INFORMATION DESIGN • DESIGN DIRECTION
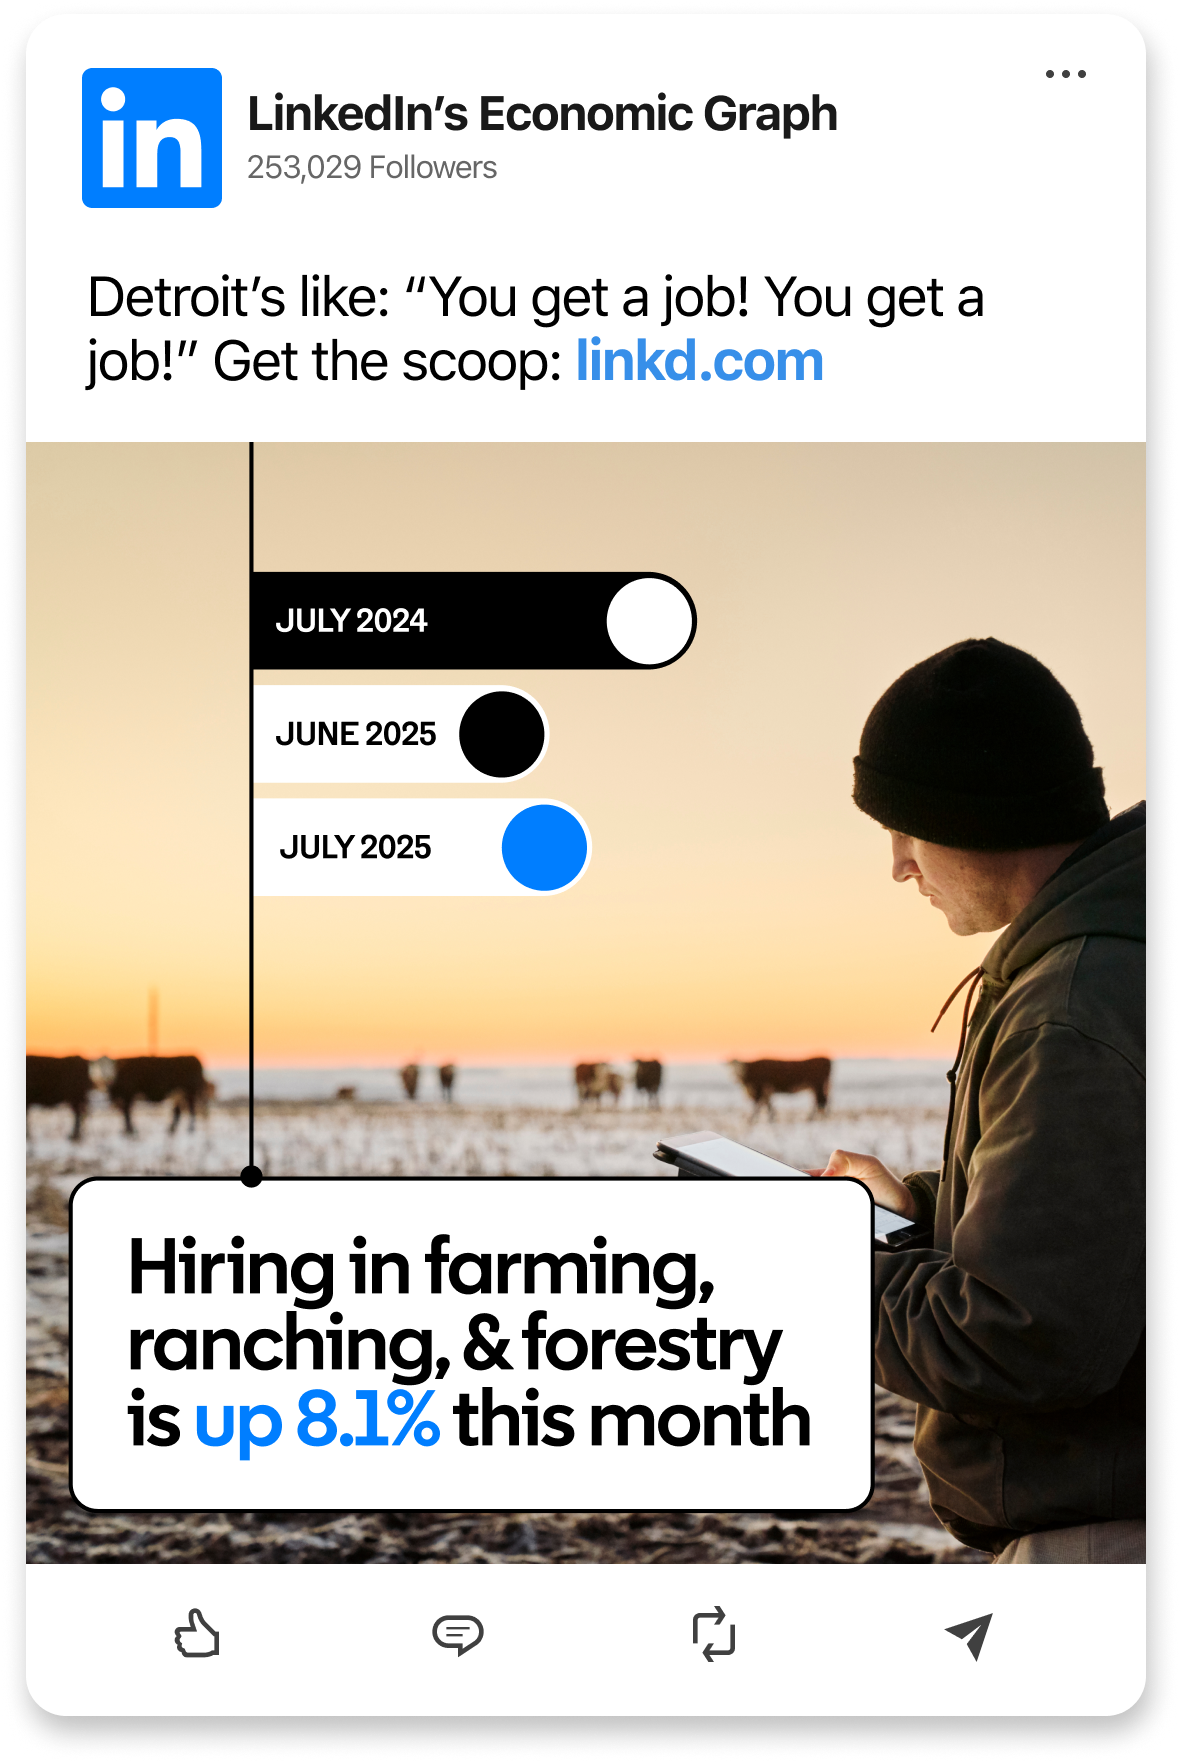
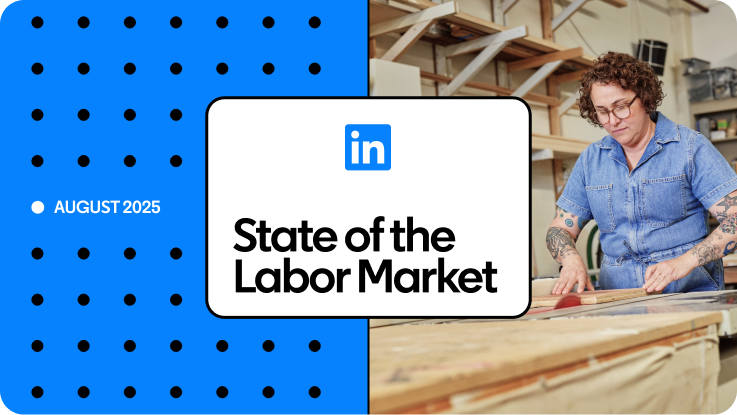
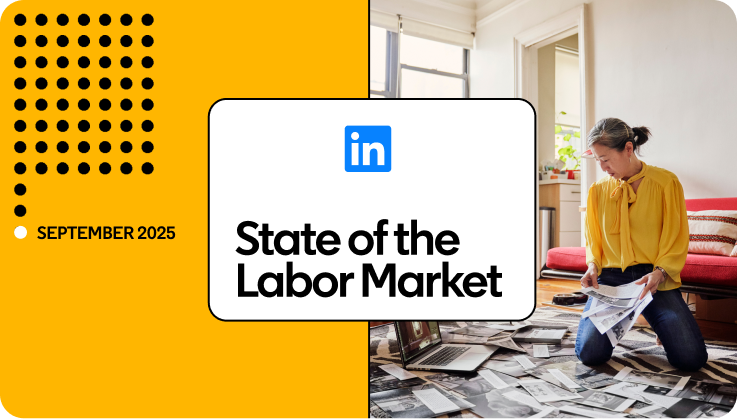
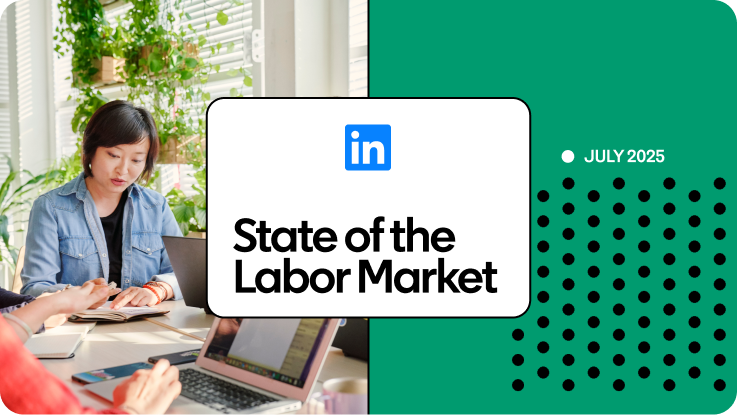
Amidst LinkedIn’s overall brand design development and ideation in 2025, I was tasked to develop a visual system for LinkedIn’s Economic Graph Research Institute — the fancy name for the division of the company that studies LinkedIn data and turns it into thought leadership for businesses, individuals, and policy makers around the world.
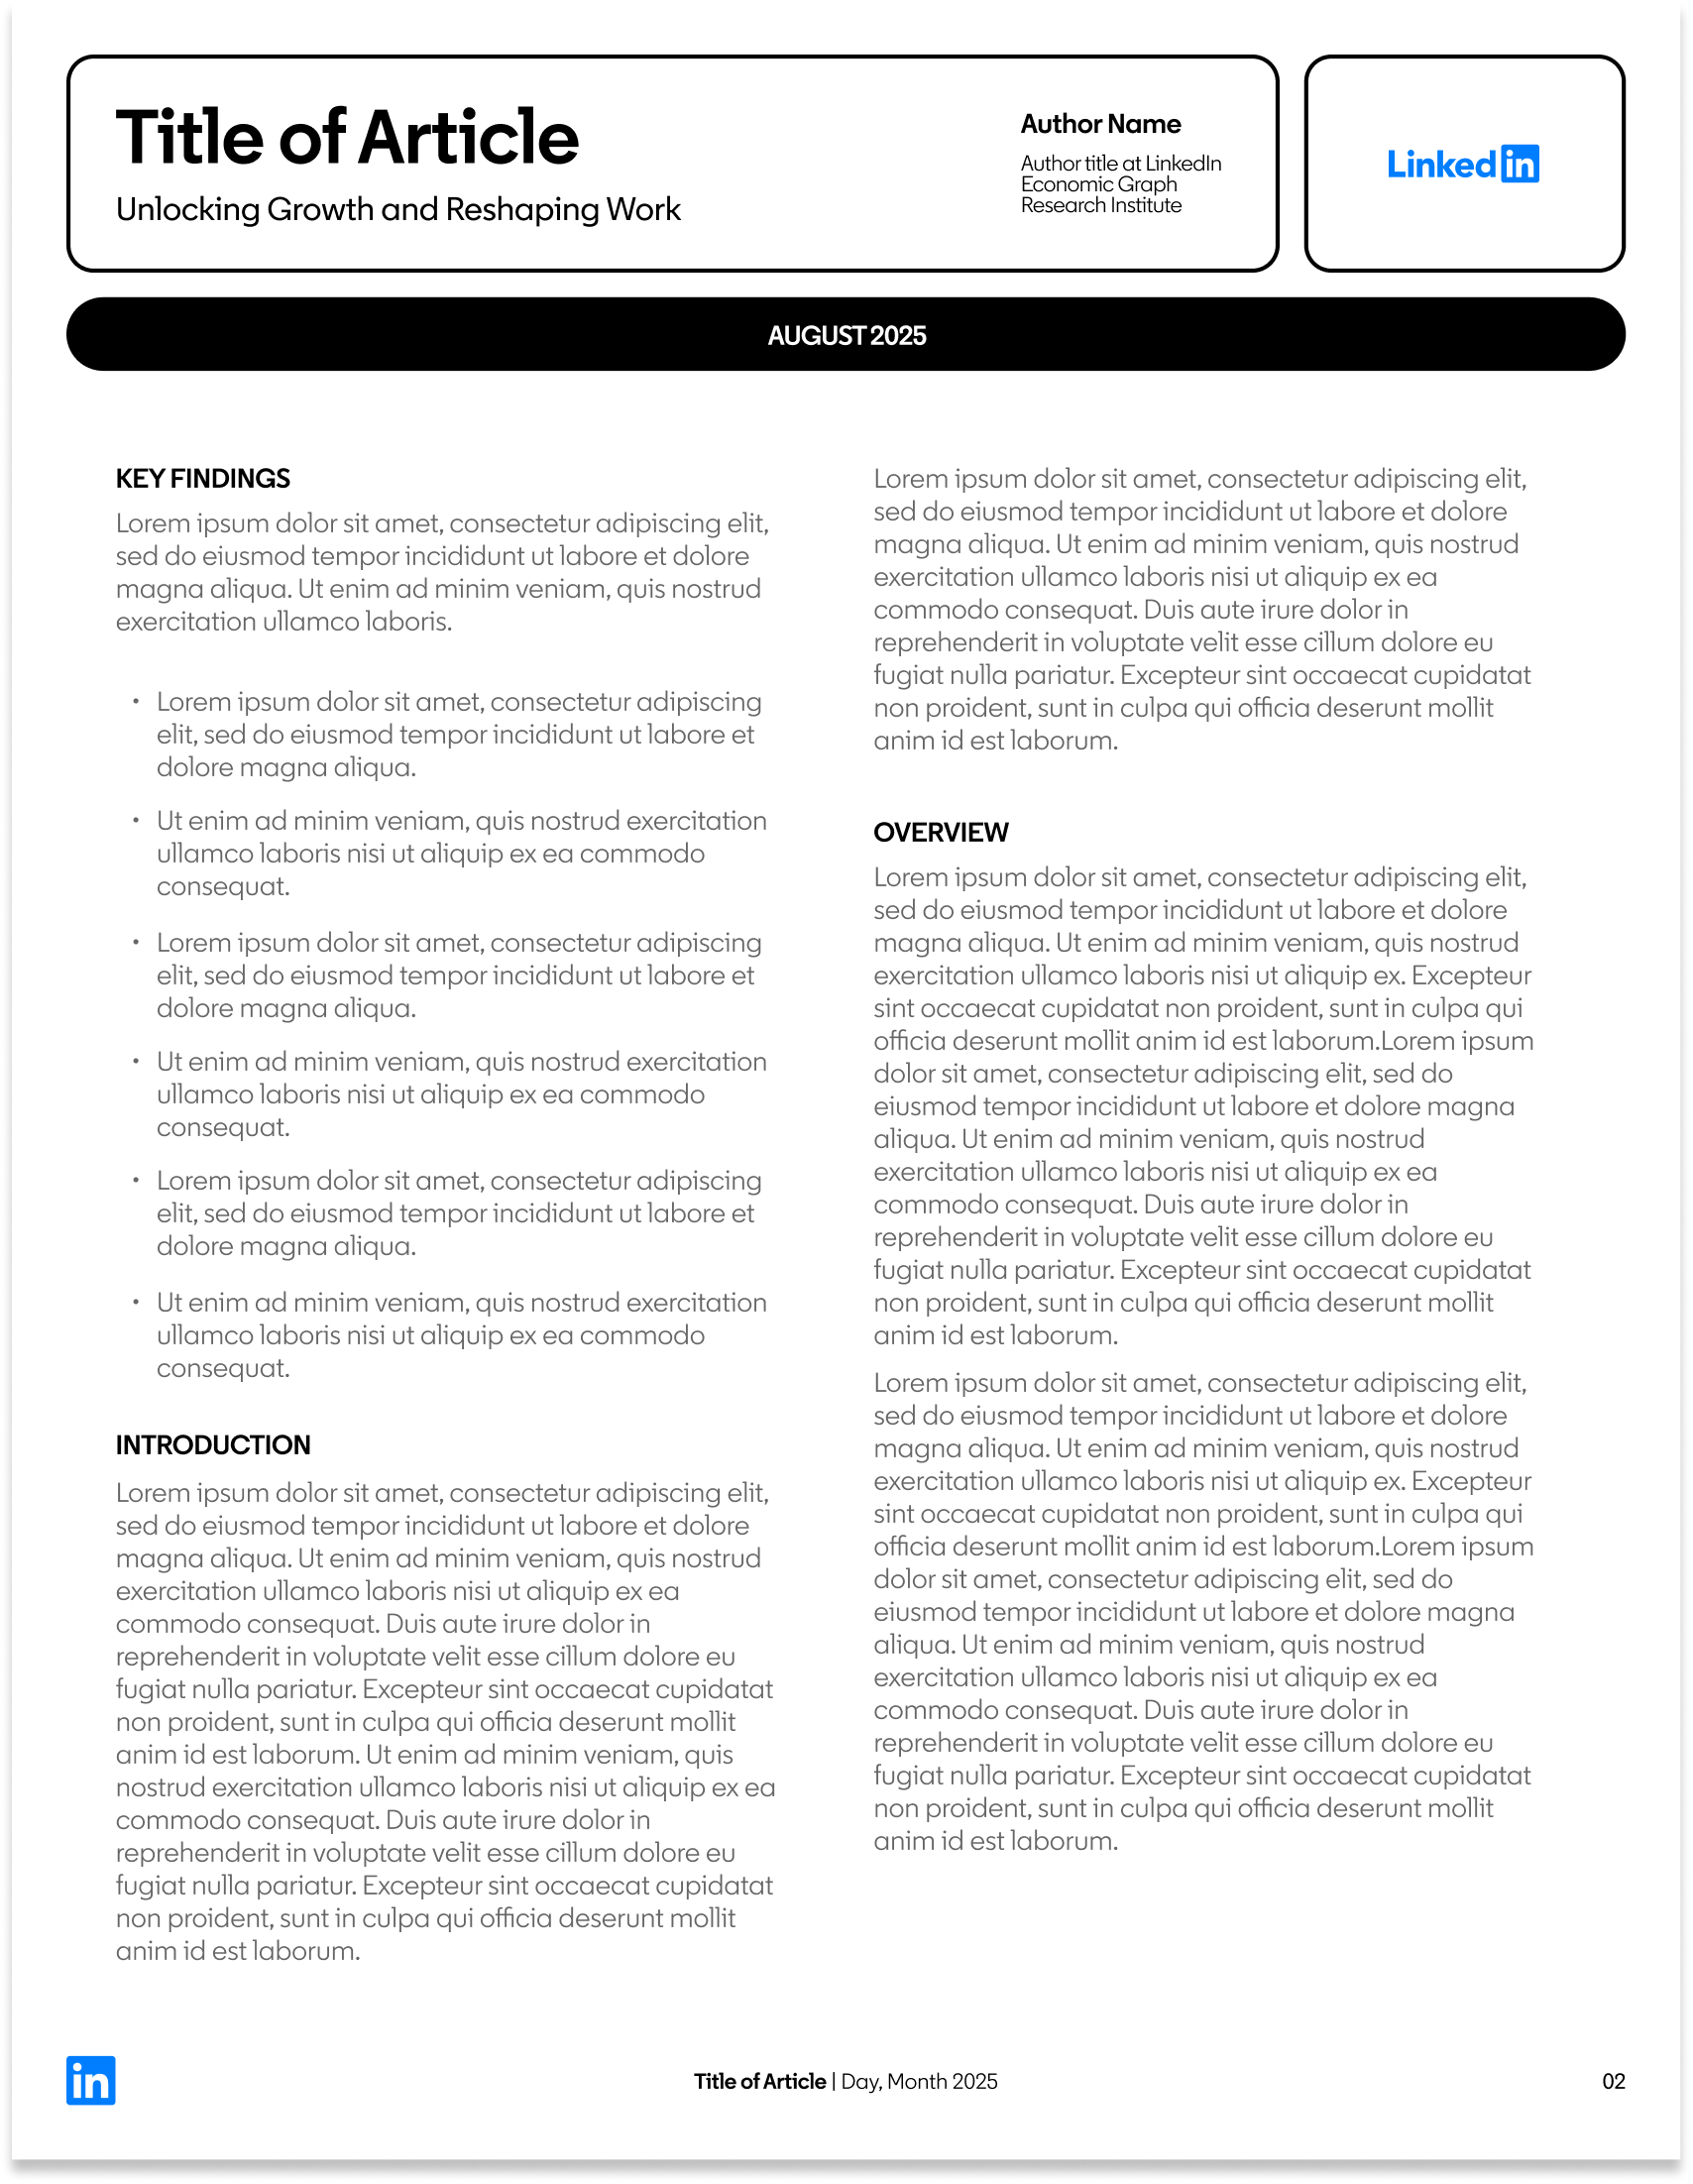
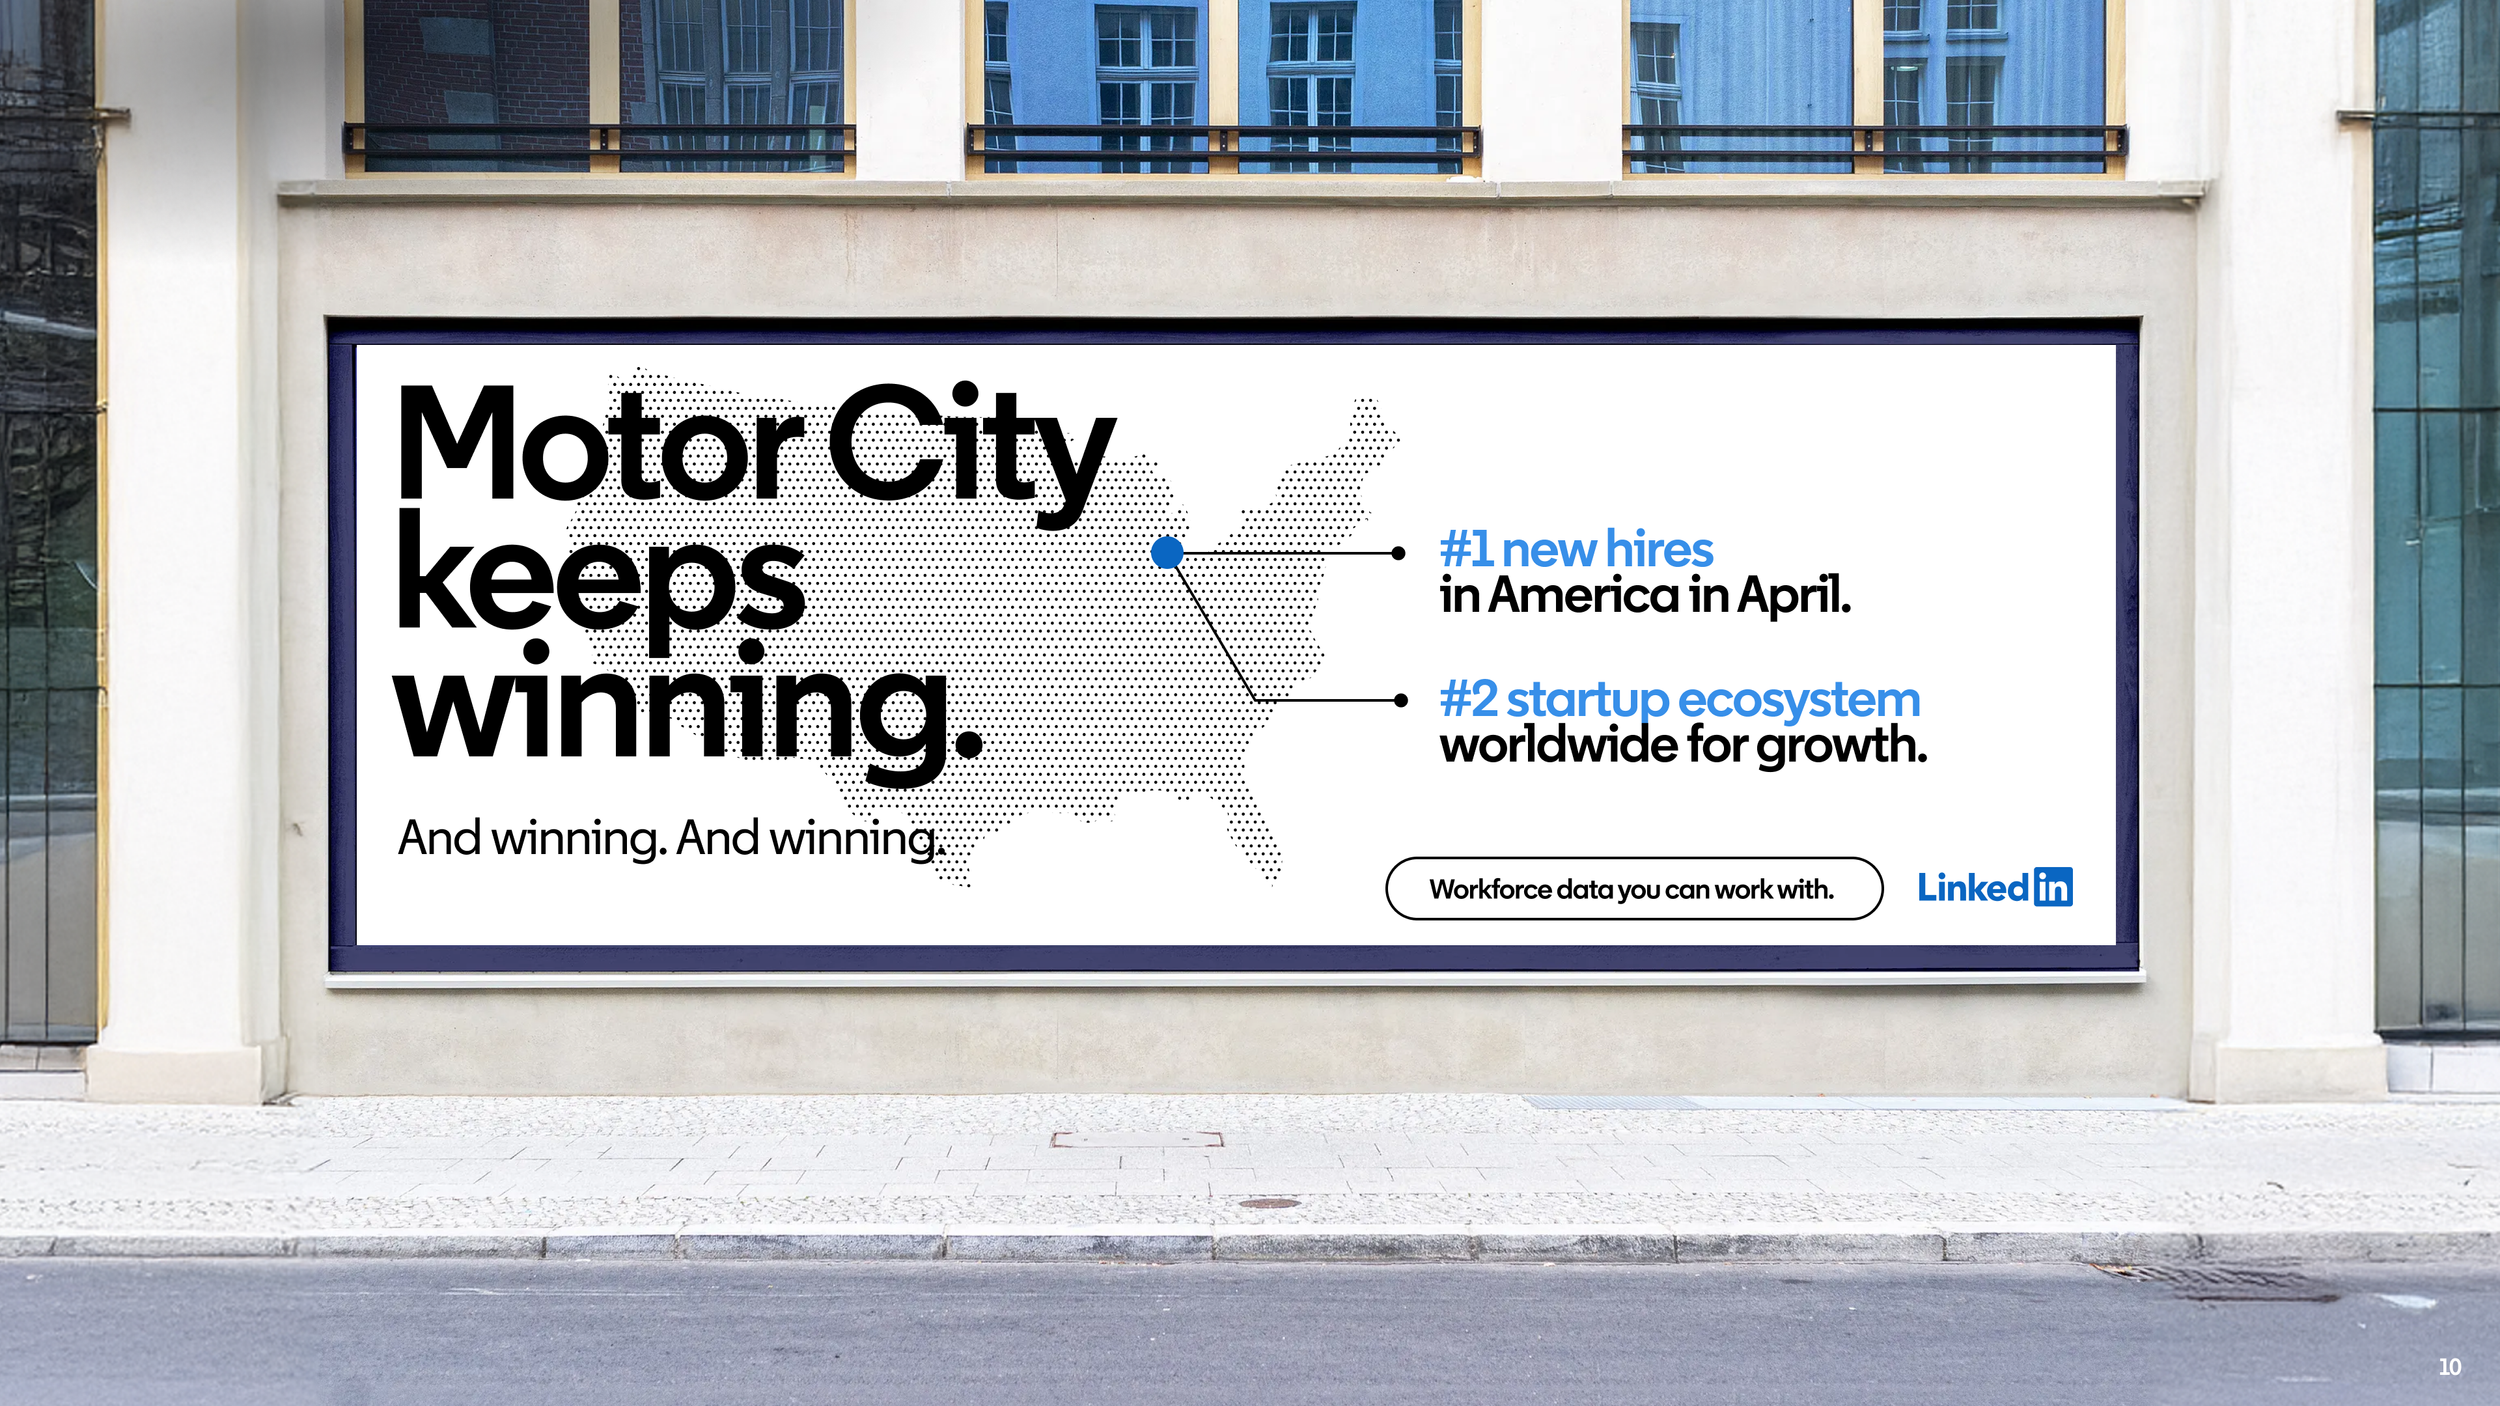
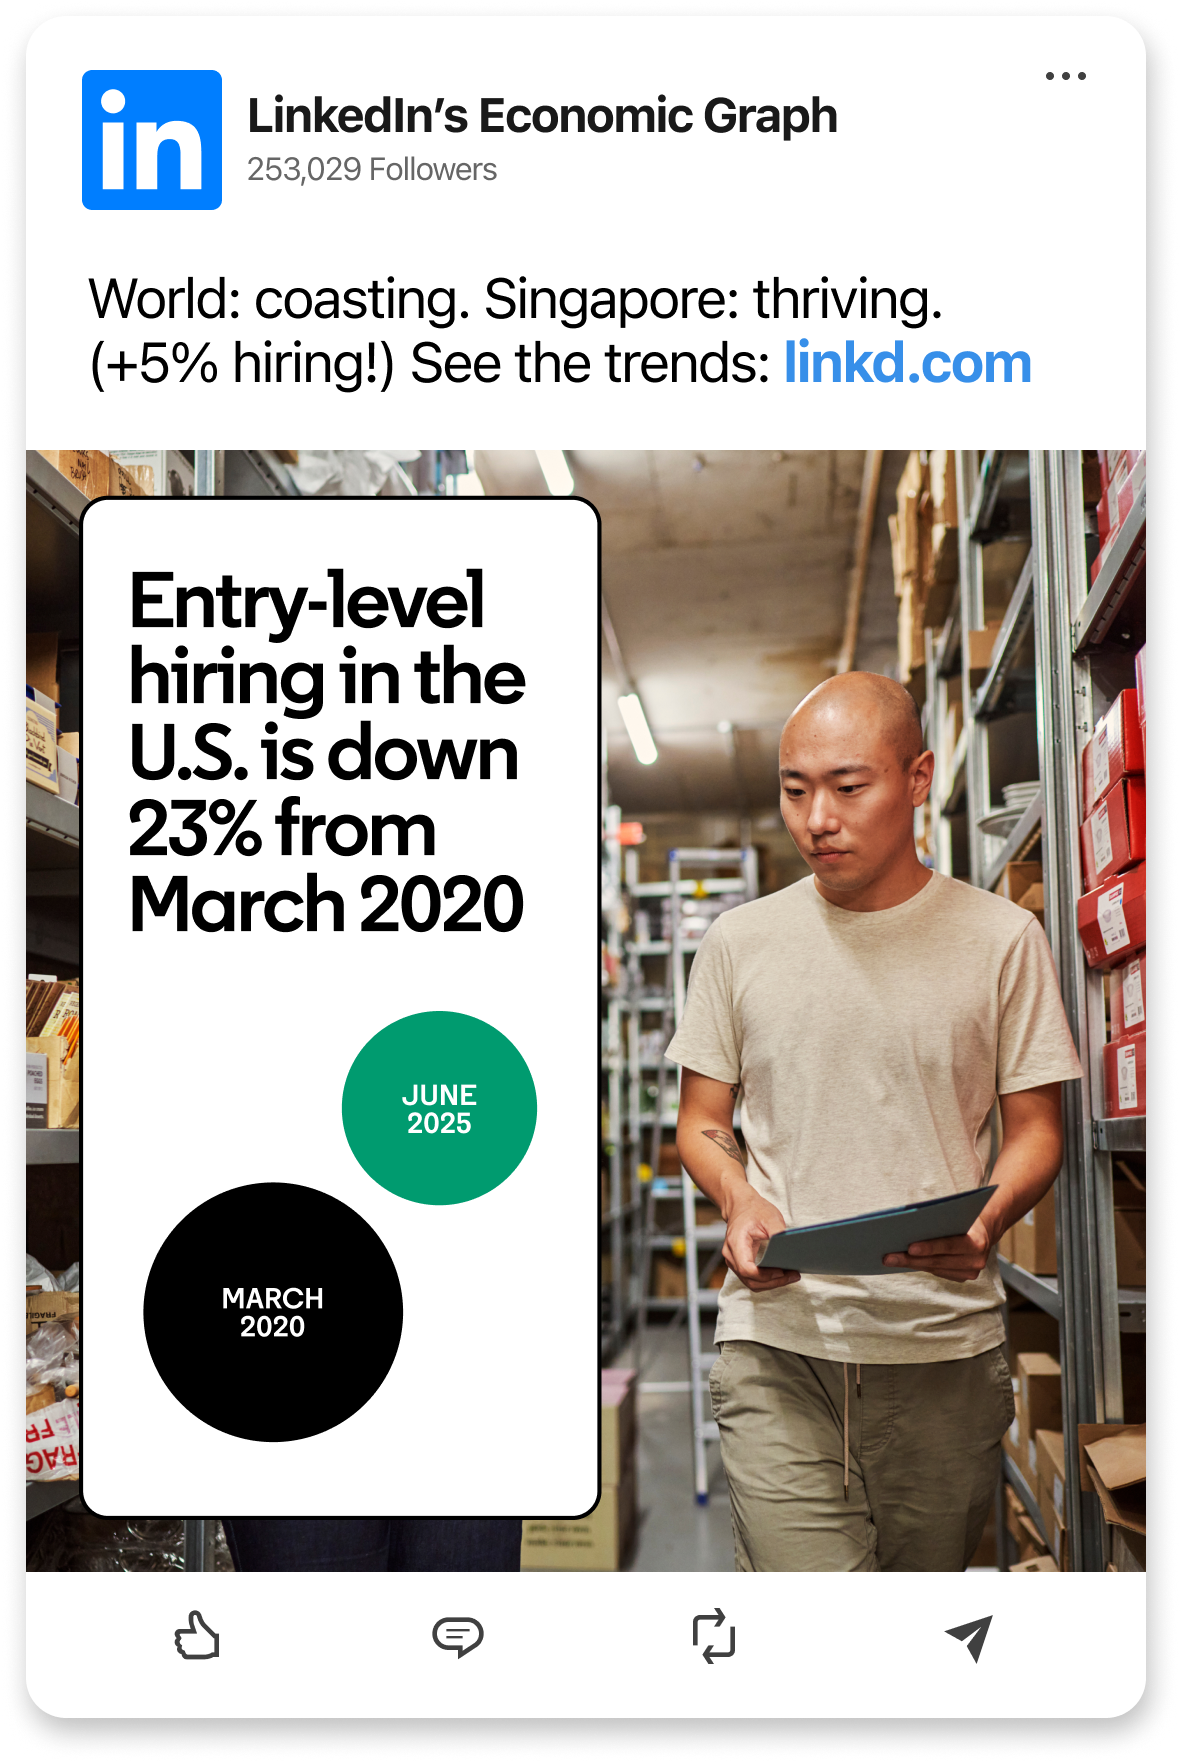
I ultimately created a design system with a fixed and flexed approach to establish a cohesive visual tone across a range of various, custom applications. The overall visual tone was inspired by the editorial nature of the content and the possibilities of data. The design work and approach for this project strongly influenced the greater brand evolution.
COLLABORATORS
Sandi Gohn: Marketer, establishing our business focus
Eddie Paik: Copywriting, crafting the overall tone and POV
Angie McDonald: Creative and design direction
Studio 750: Production & implementation partner


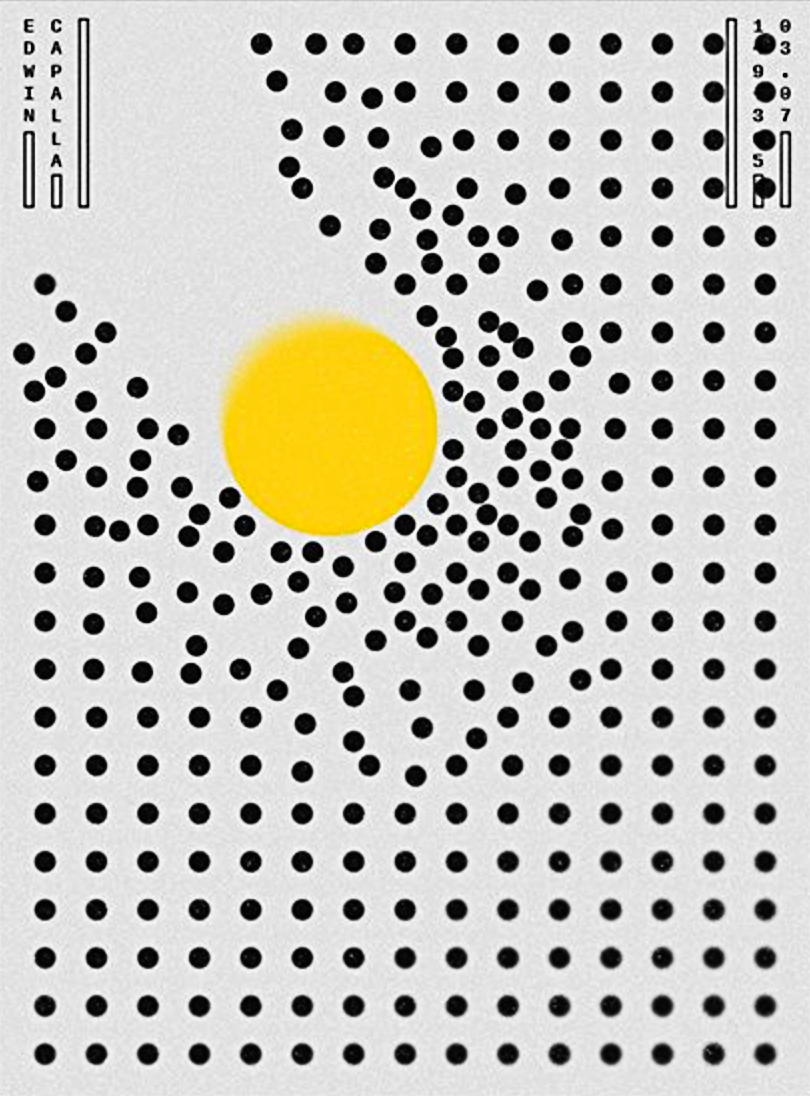
INSPIRATION
Modern yet timeless. Complex yet simple.
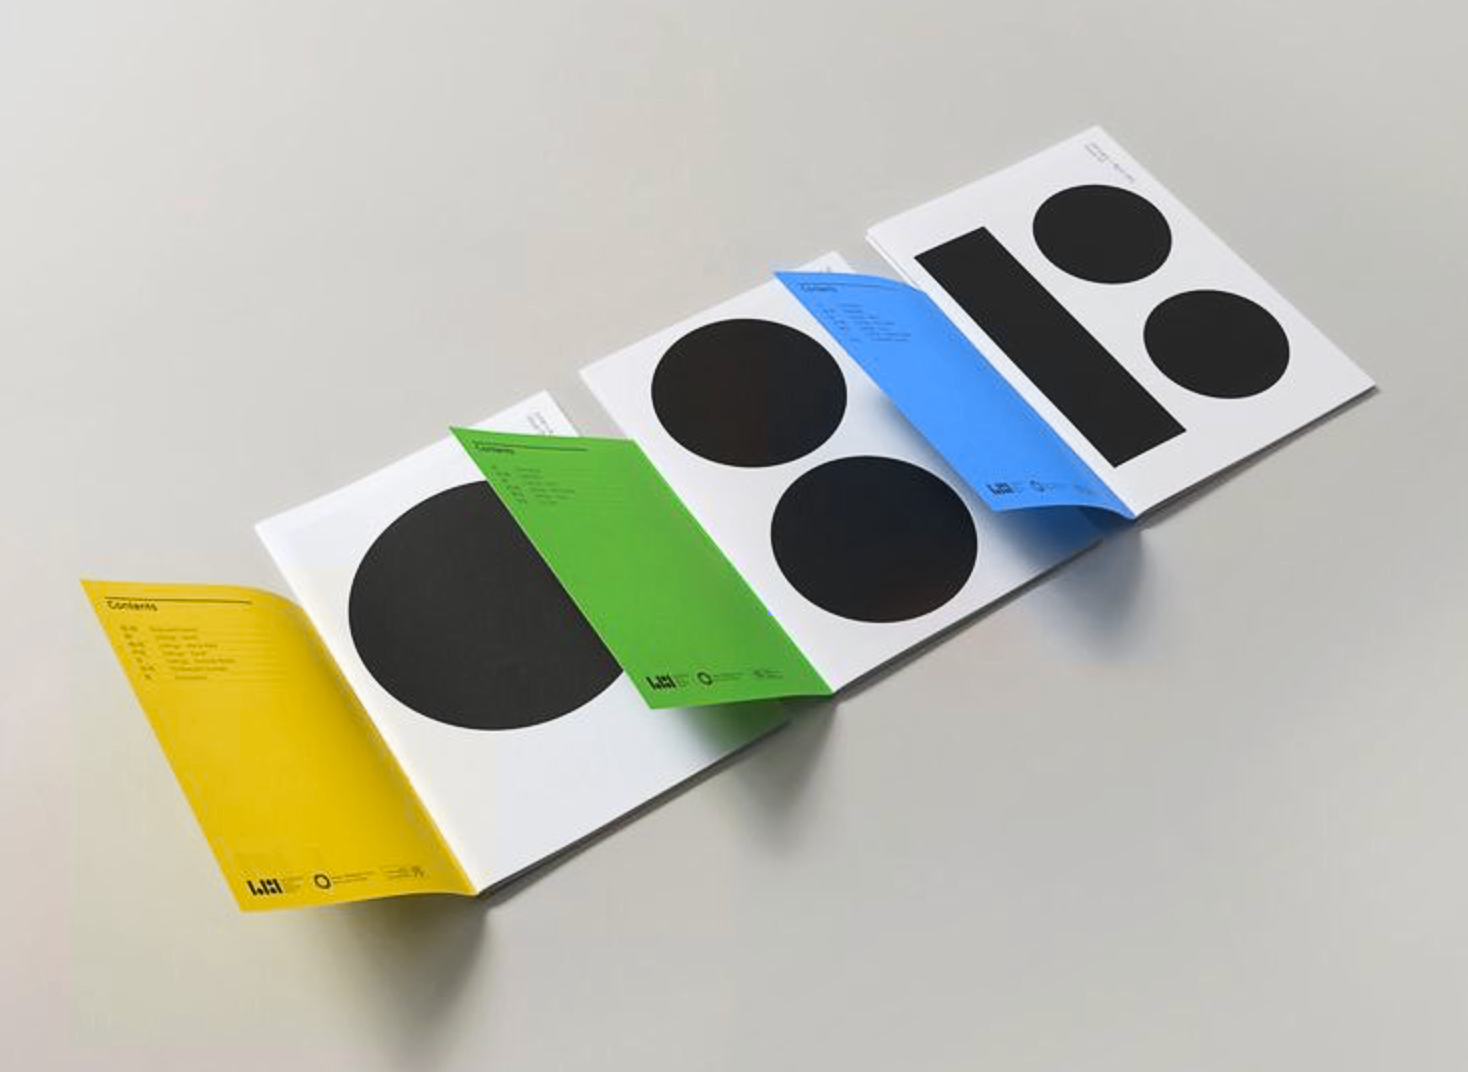

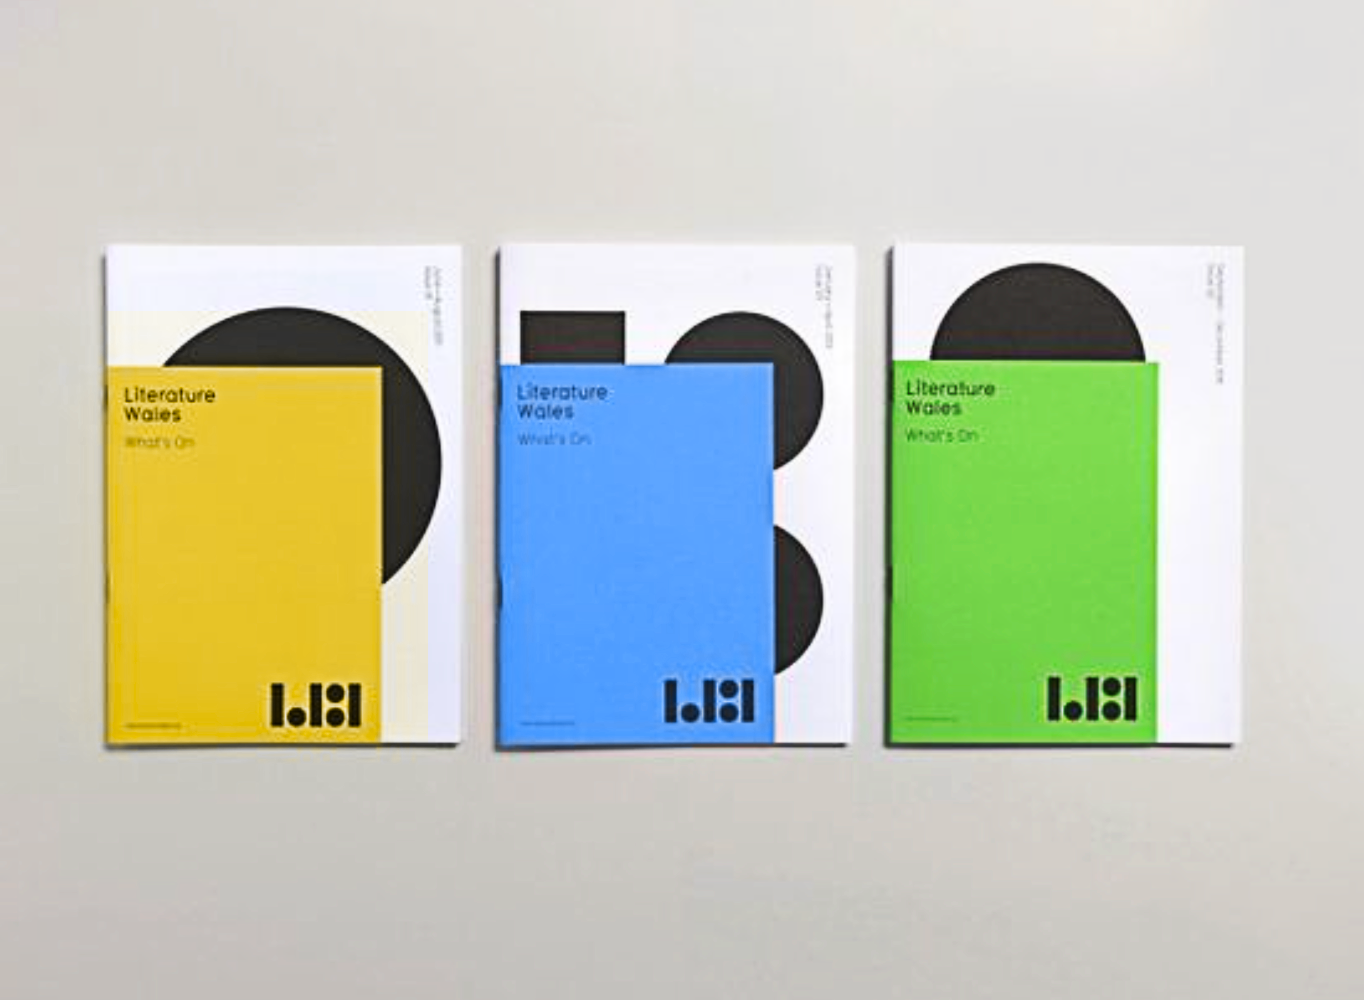

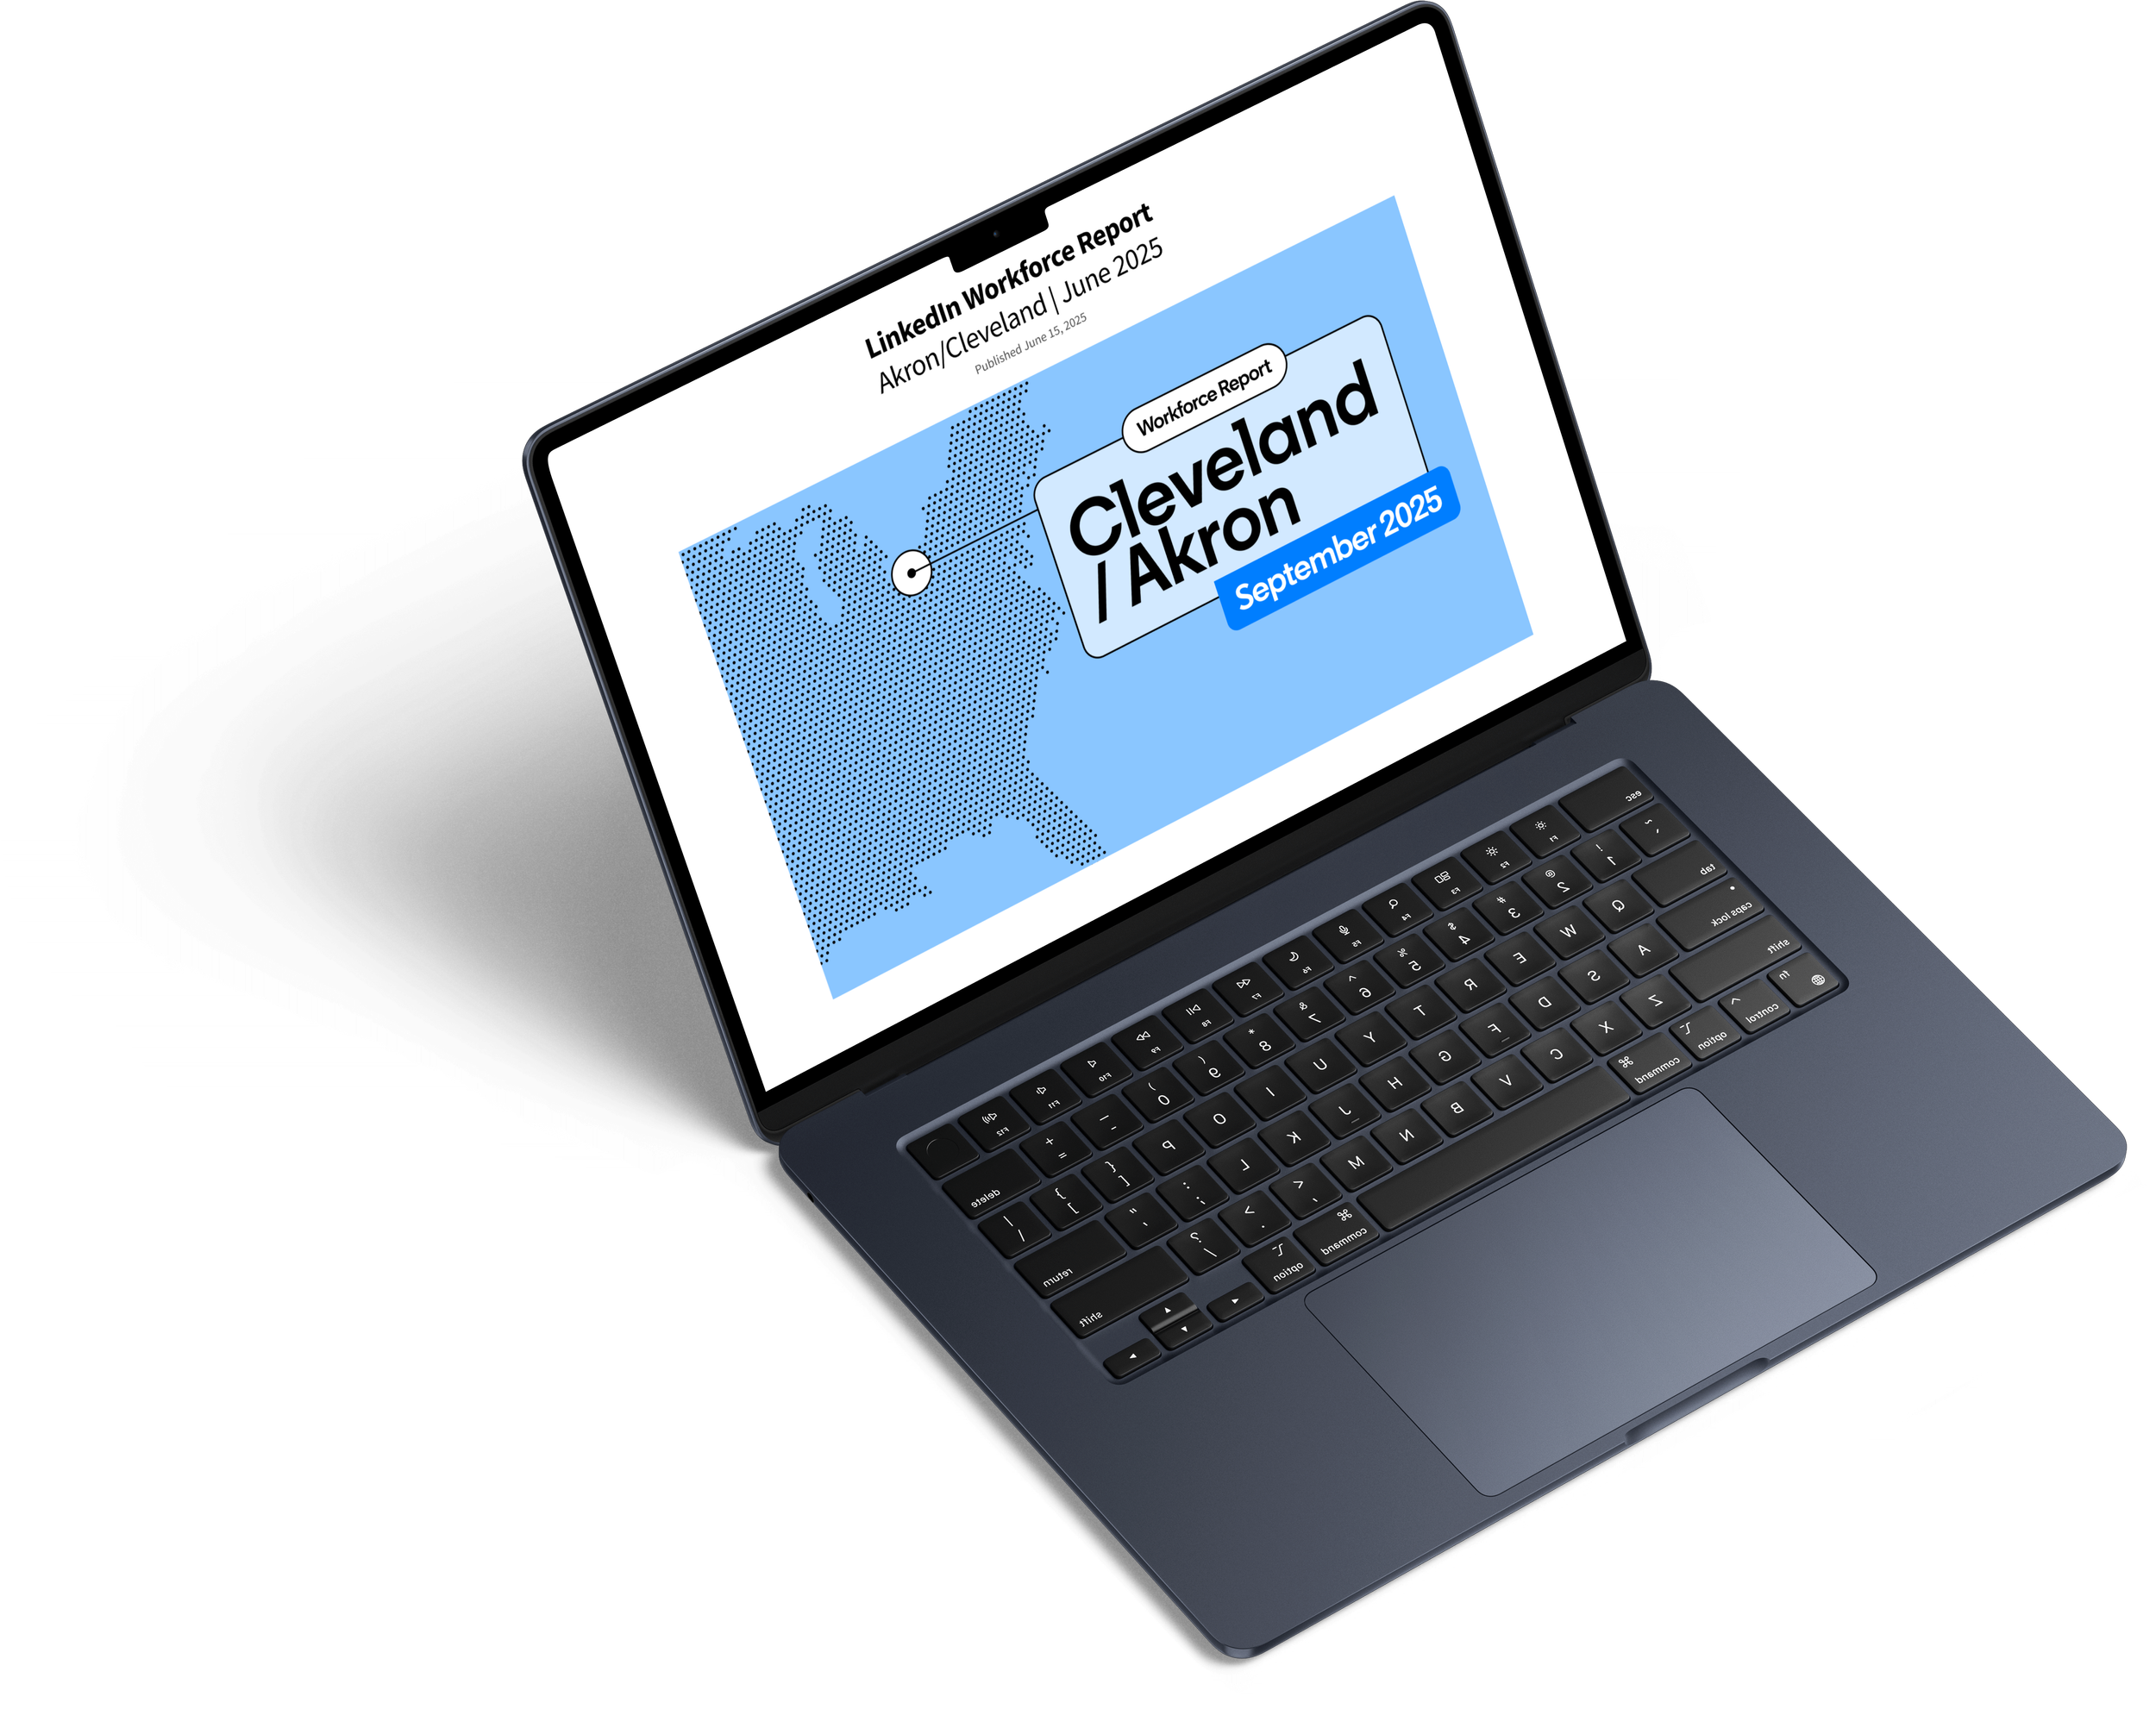
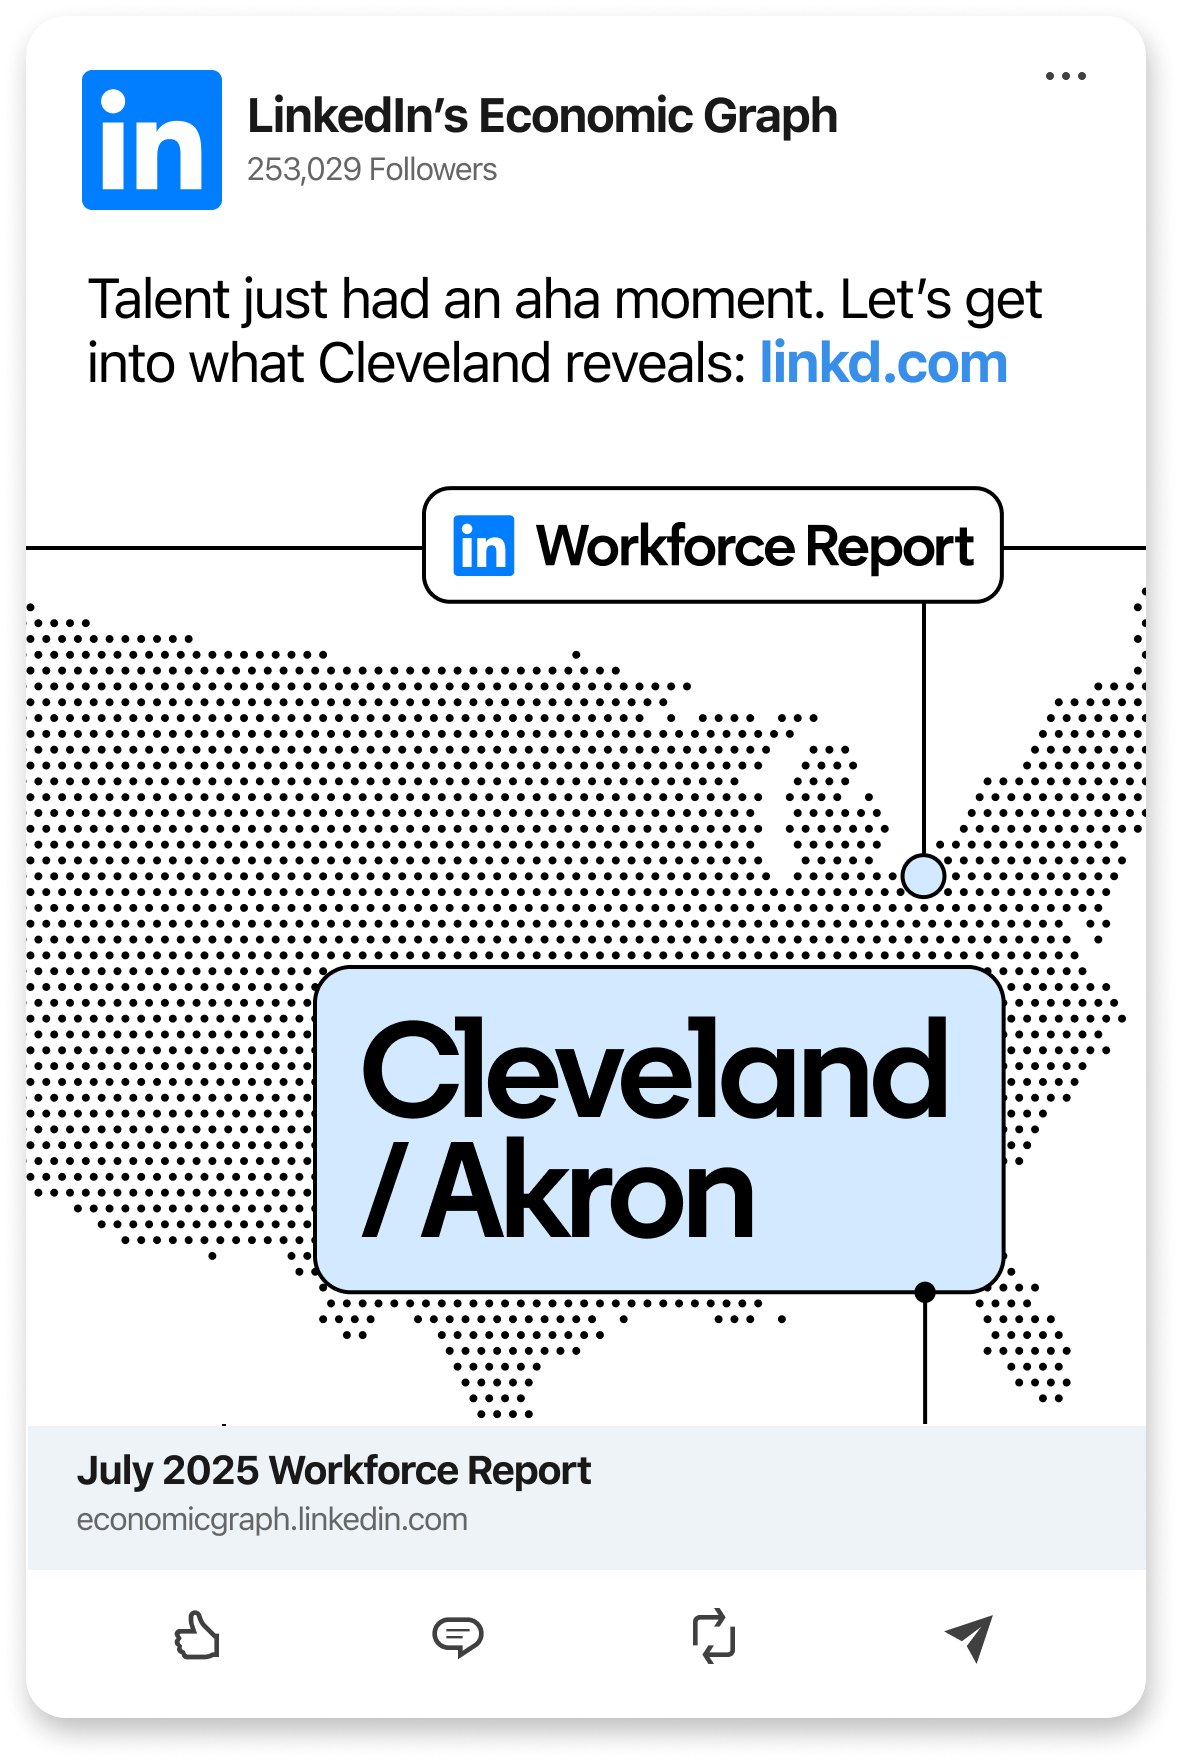
EXECUTION
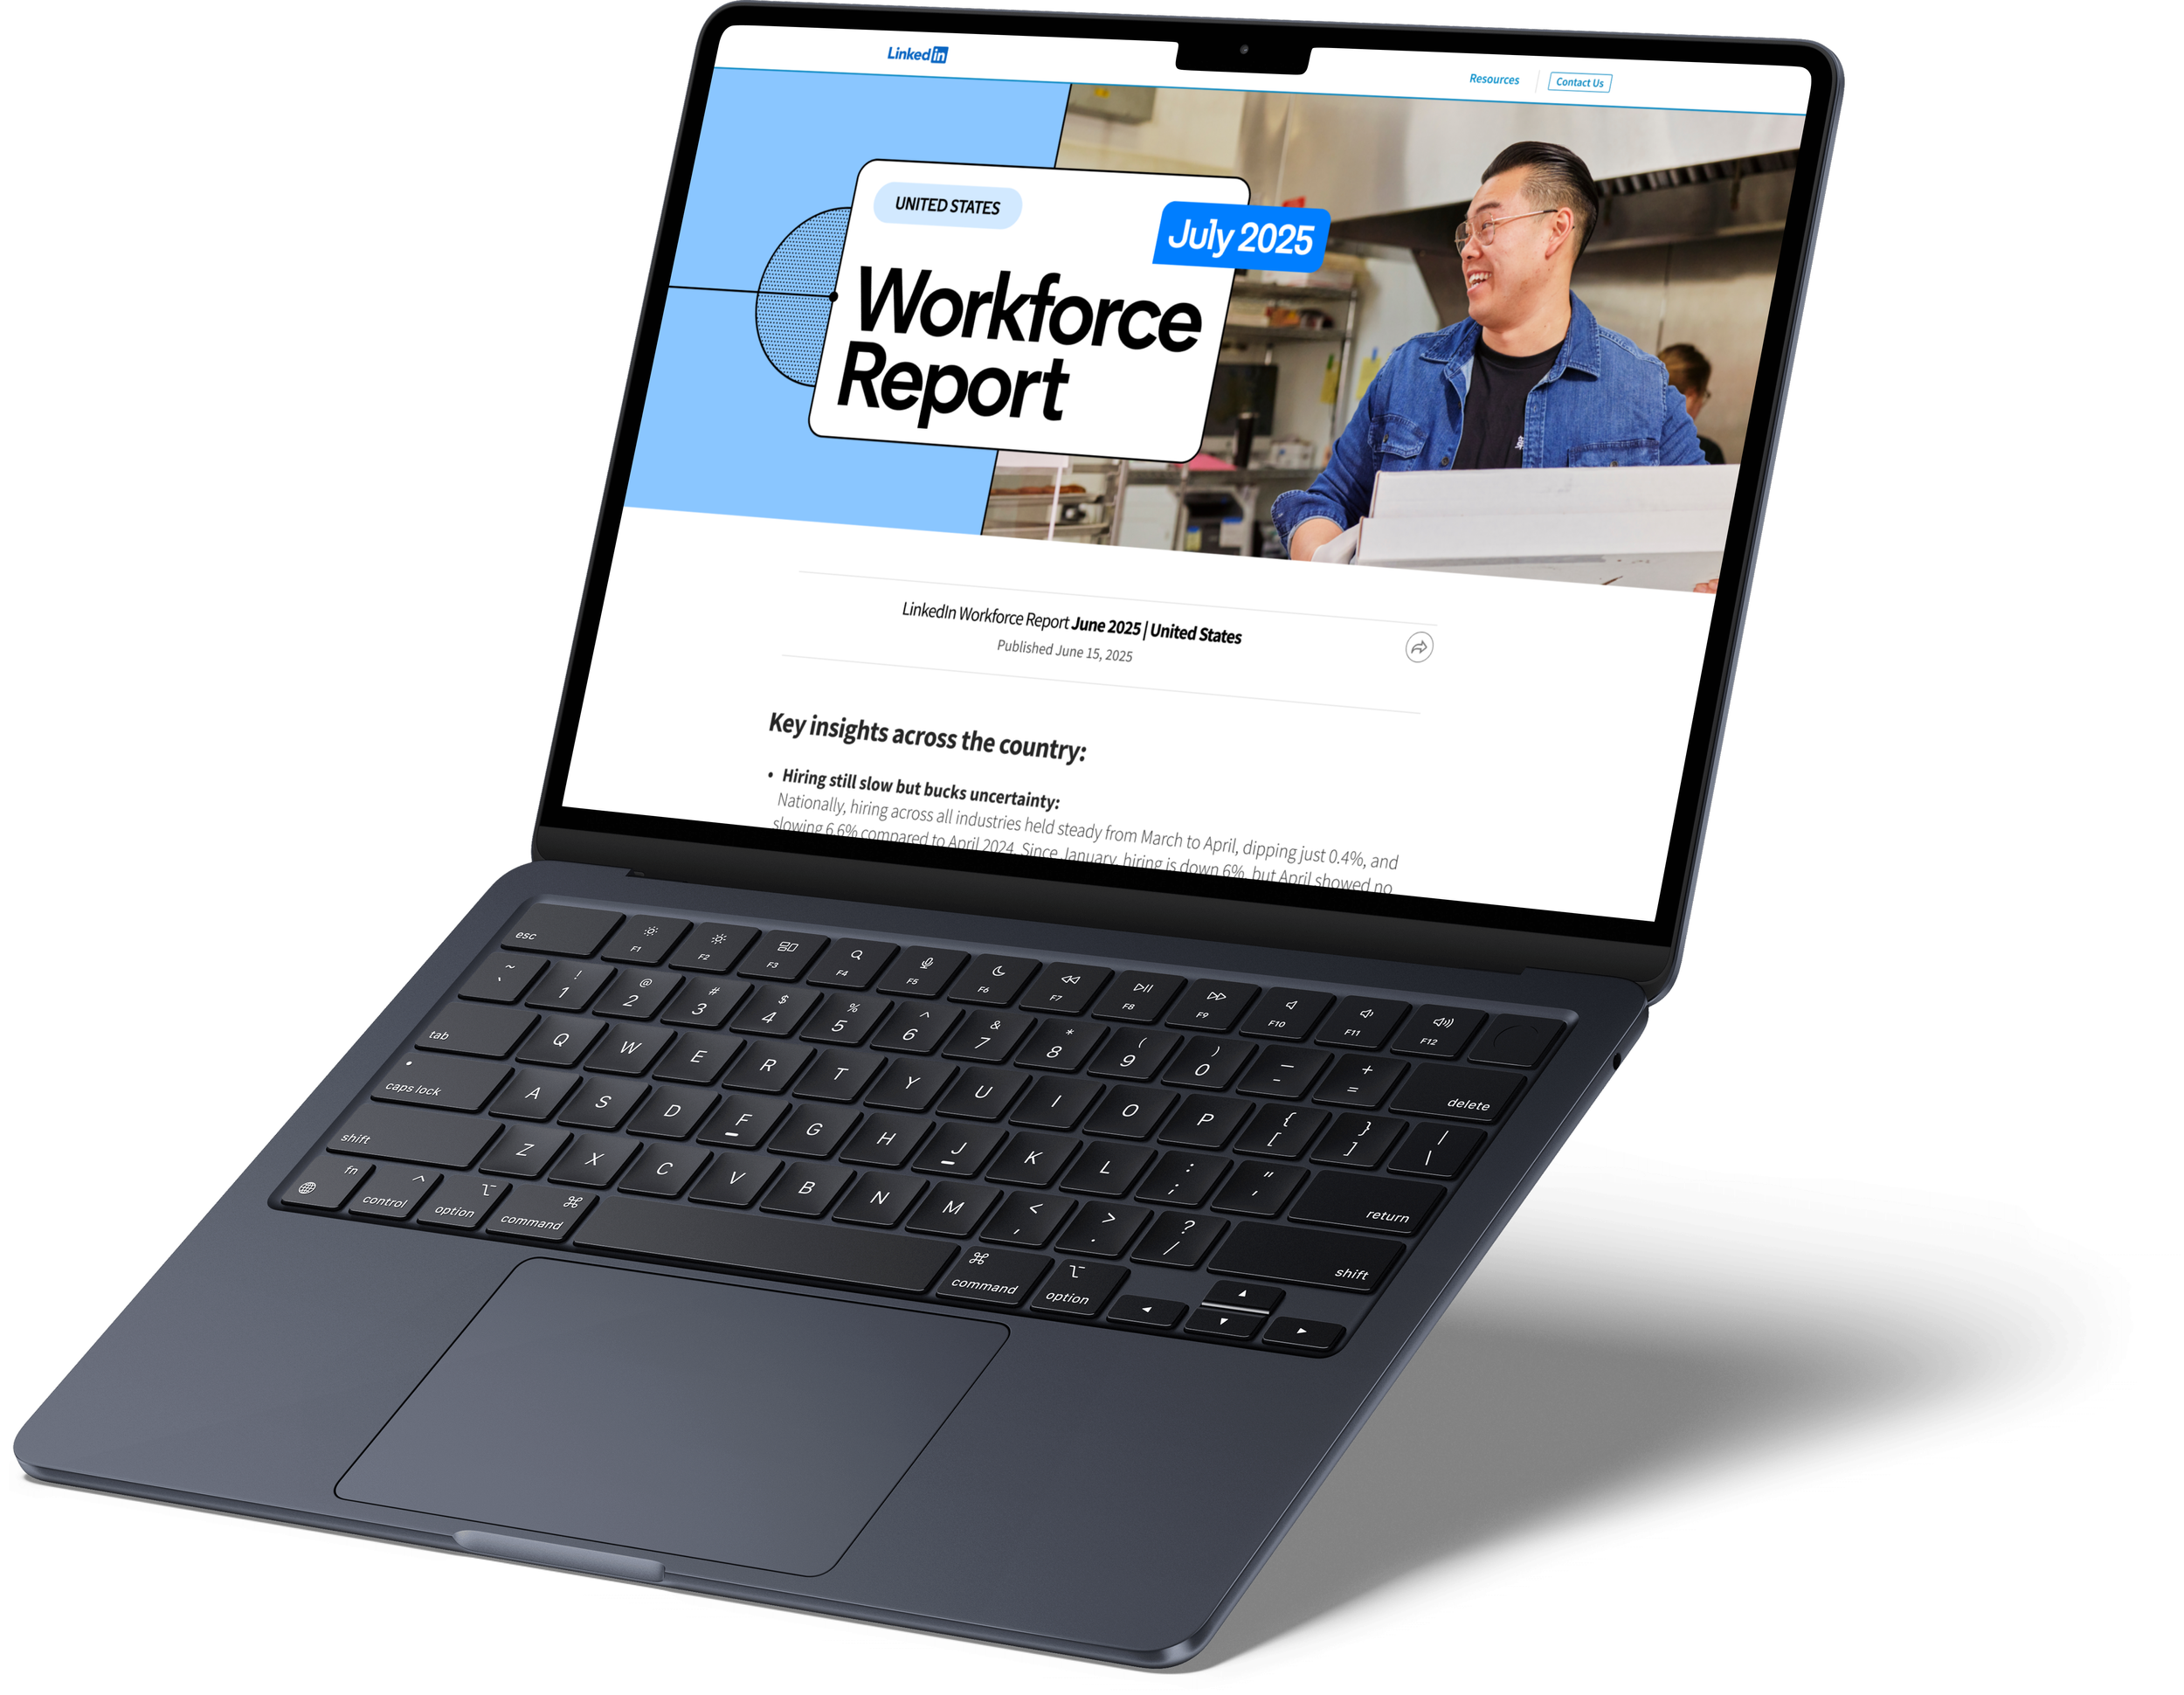
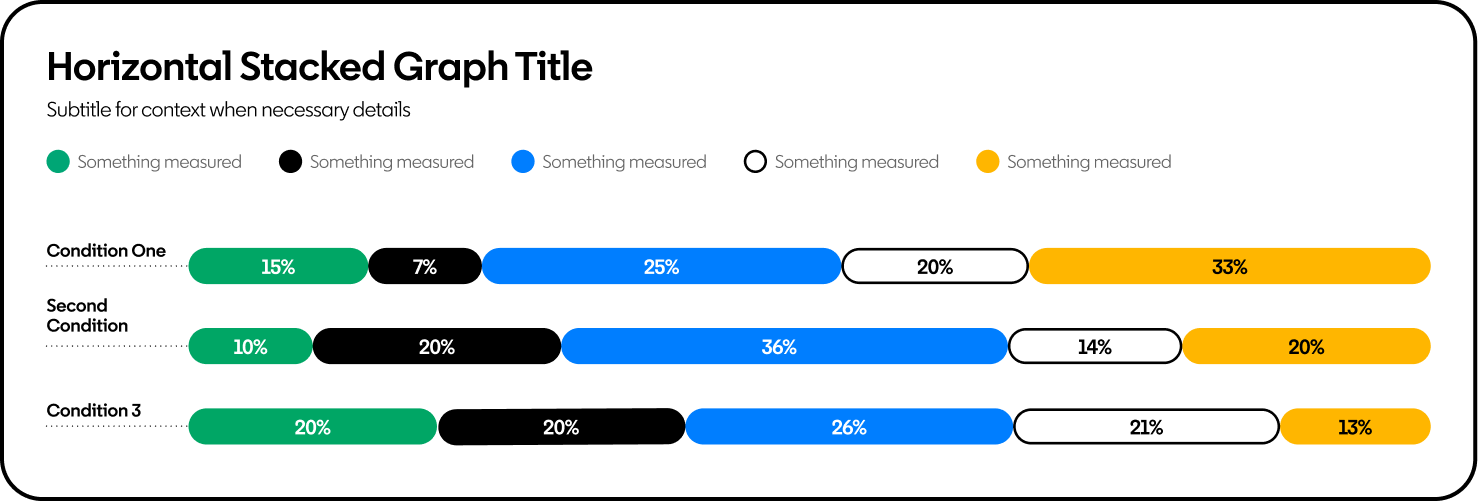
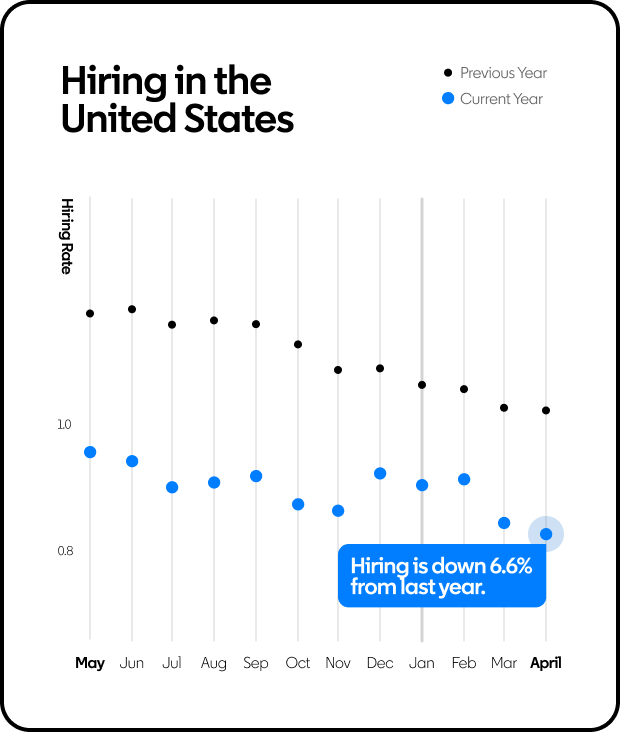
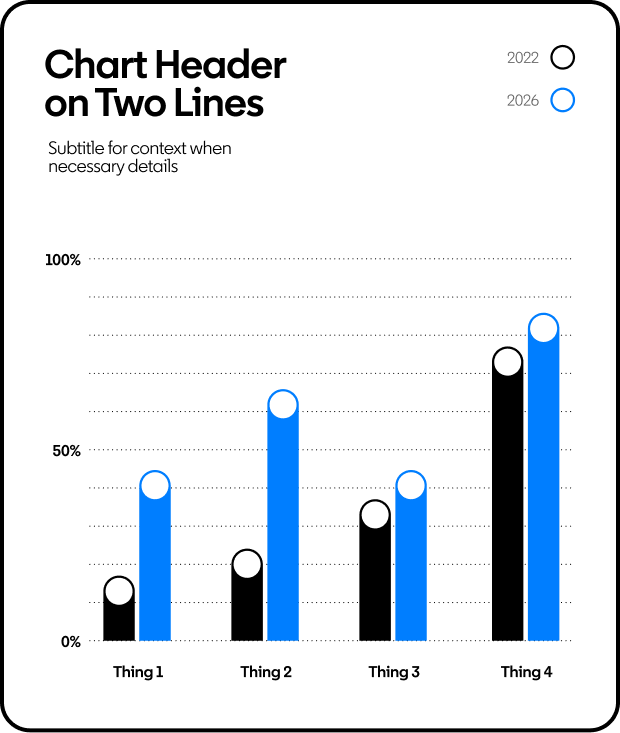
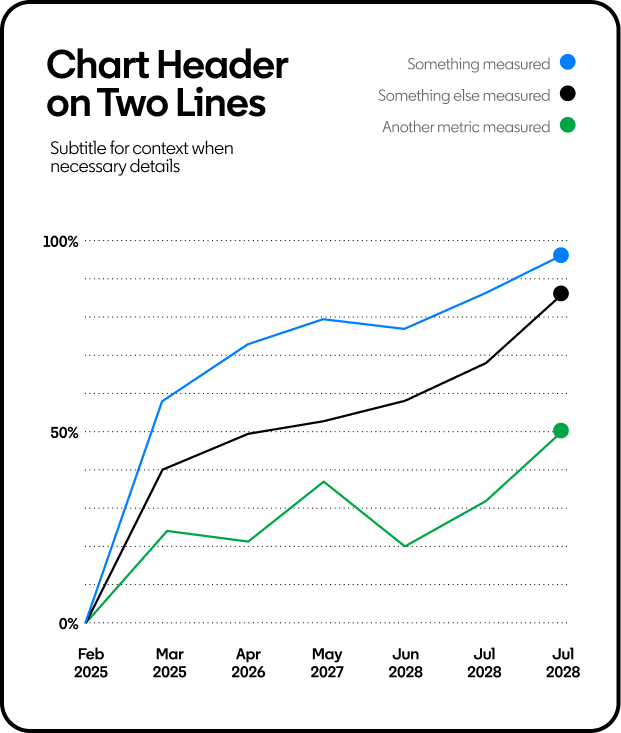
Establishing the visual system across a range of business needs.
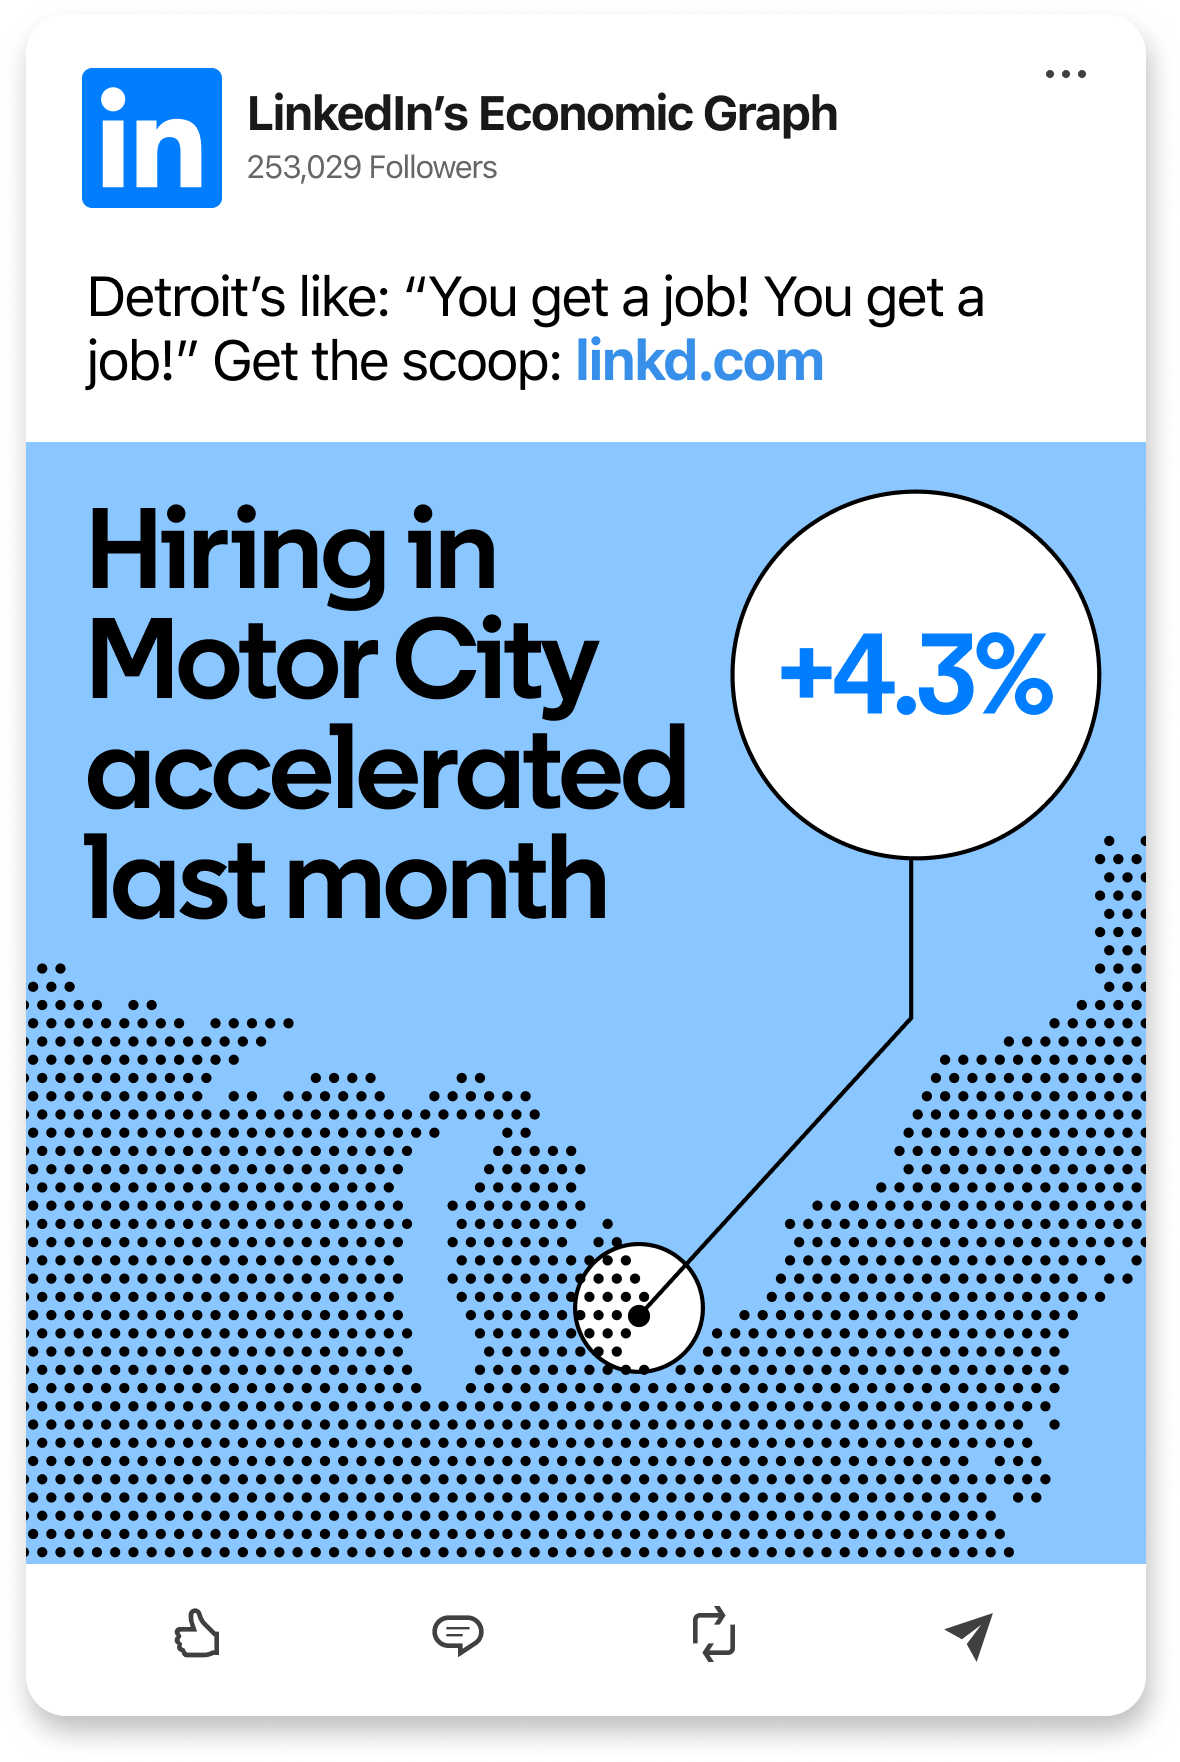
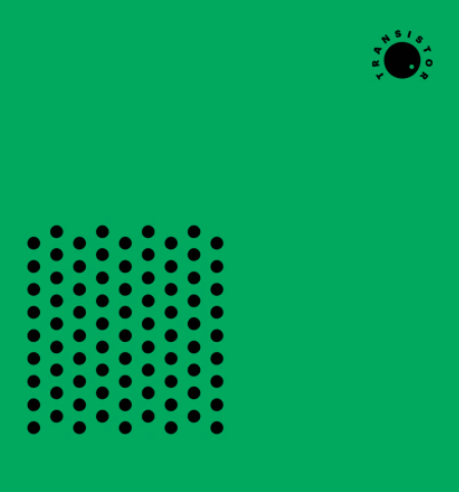
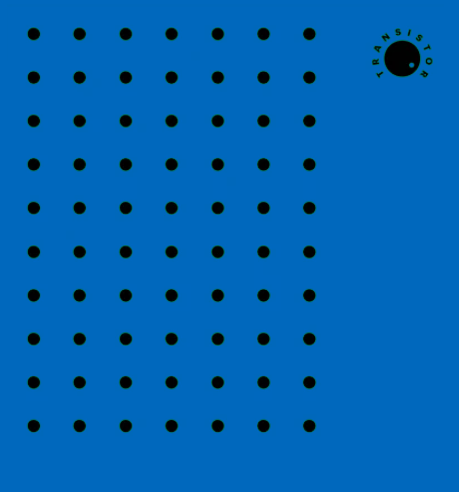
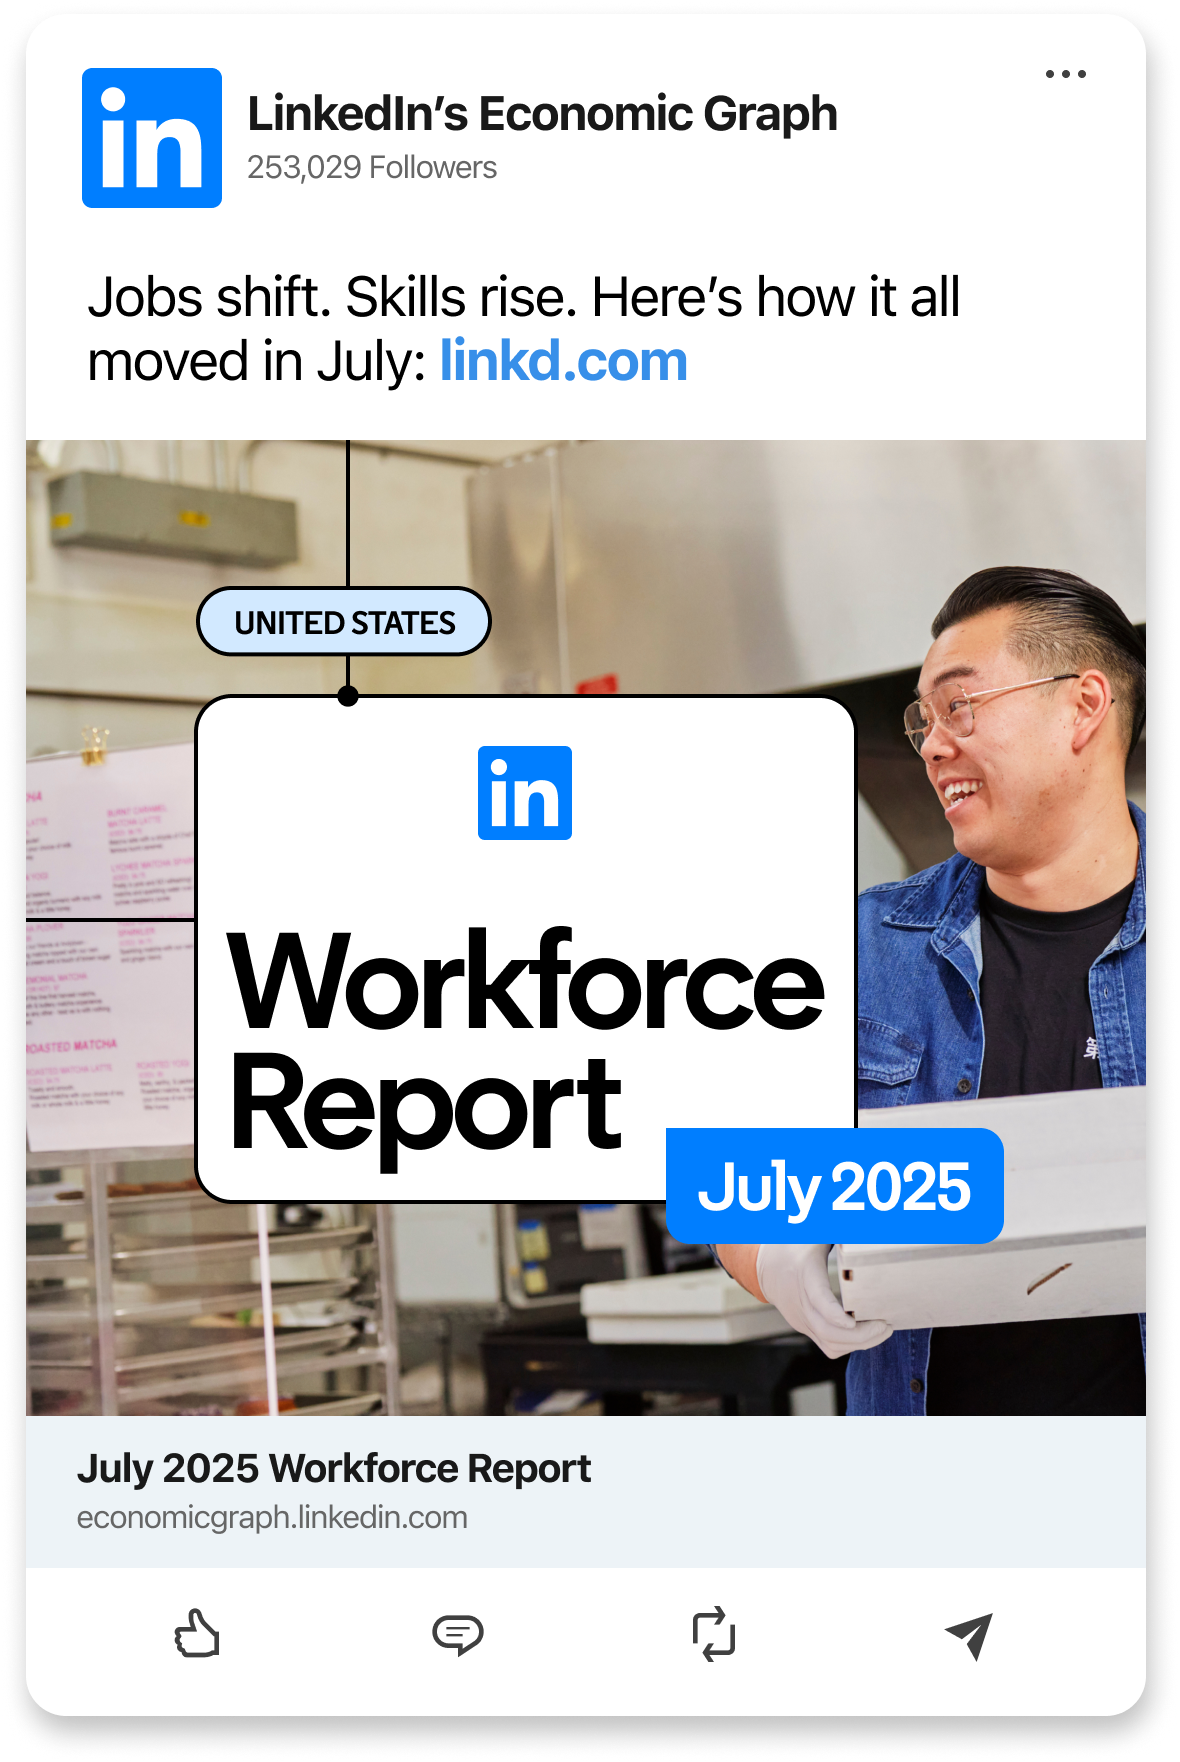
SYSTEM BUILDING
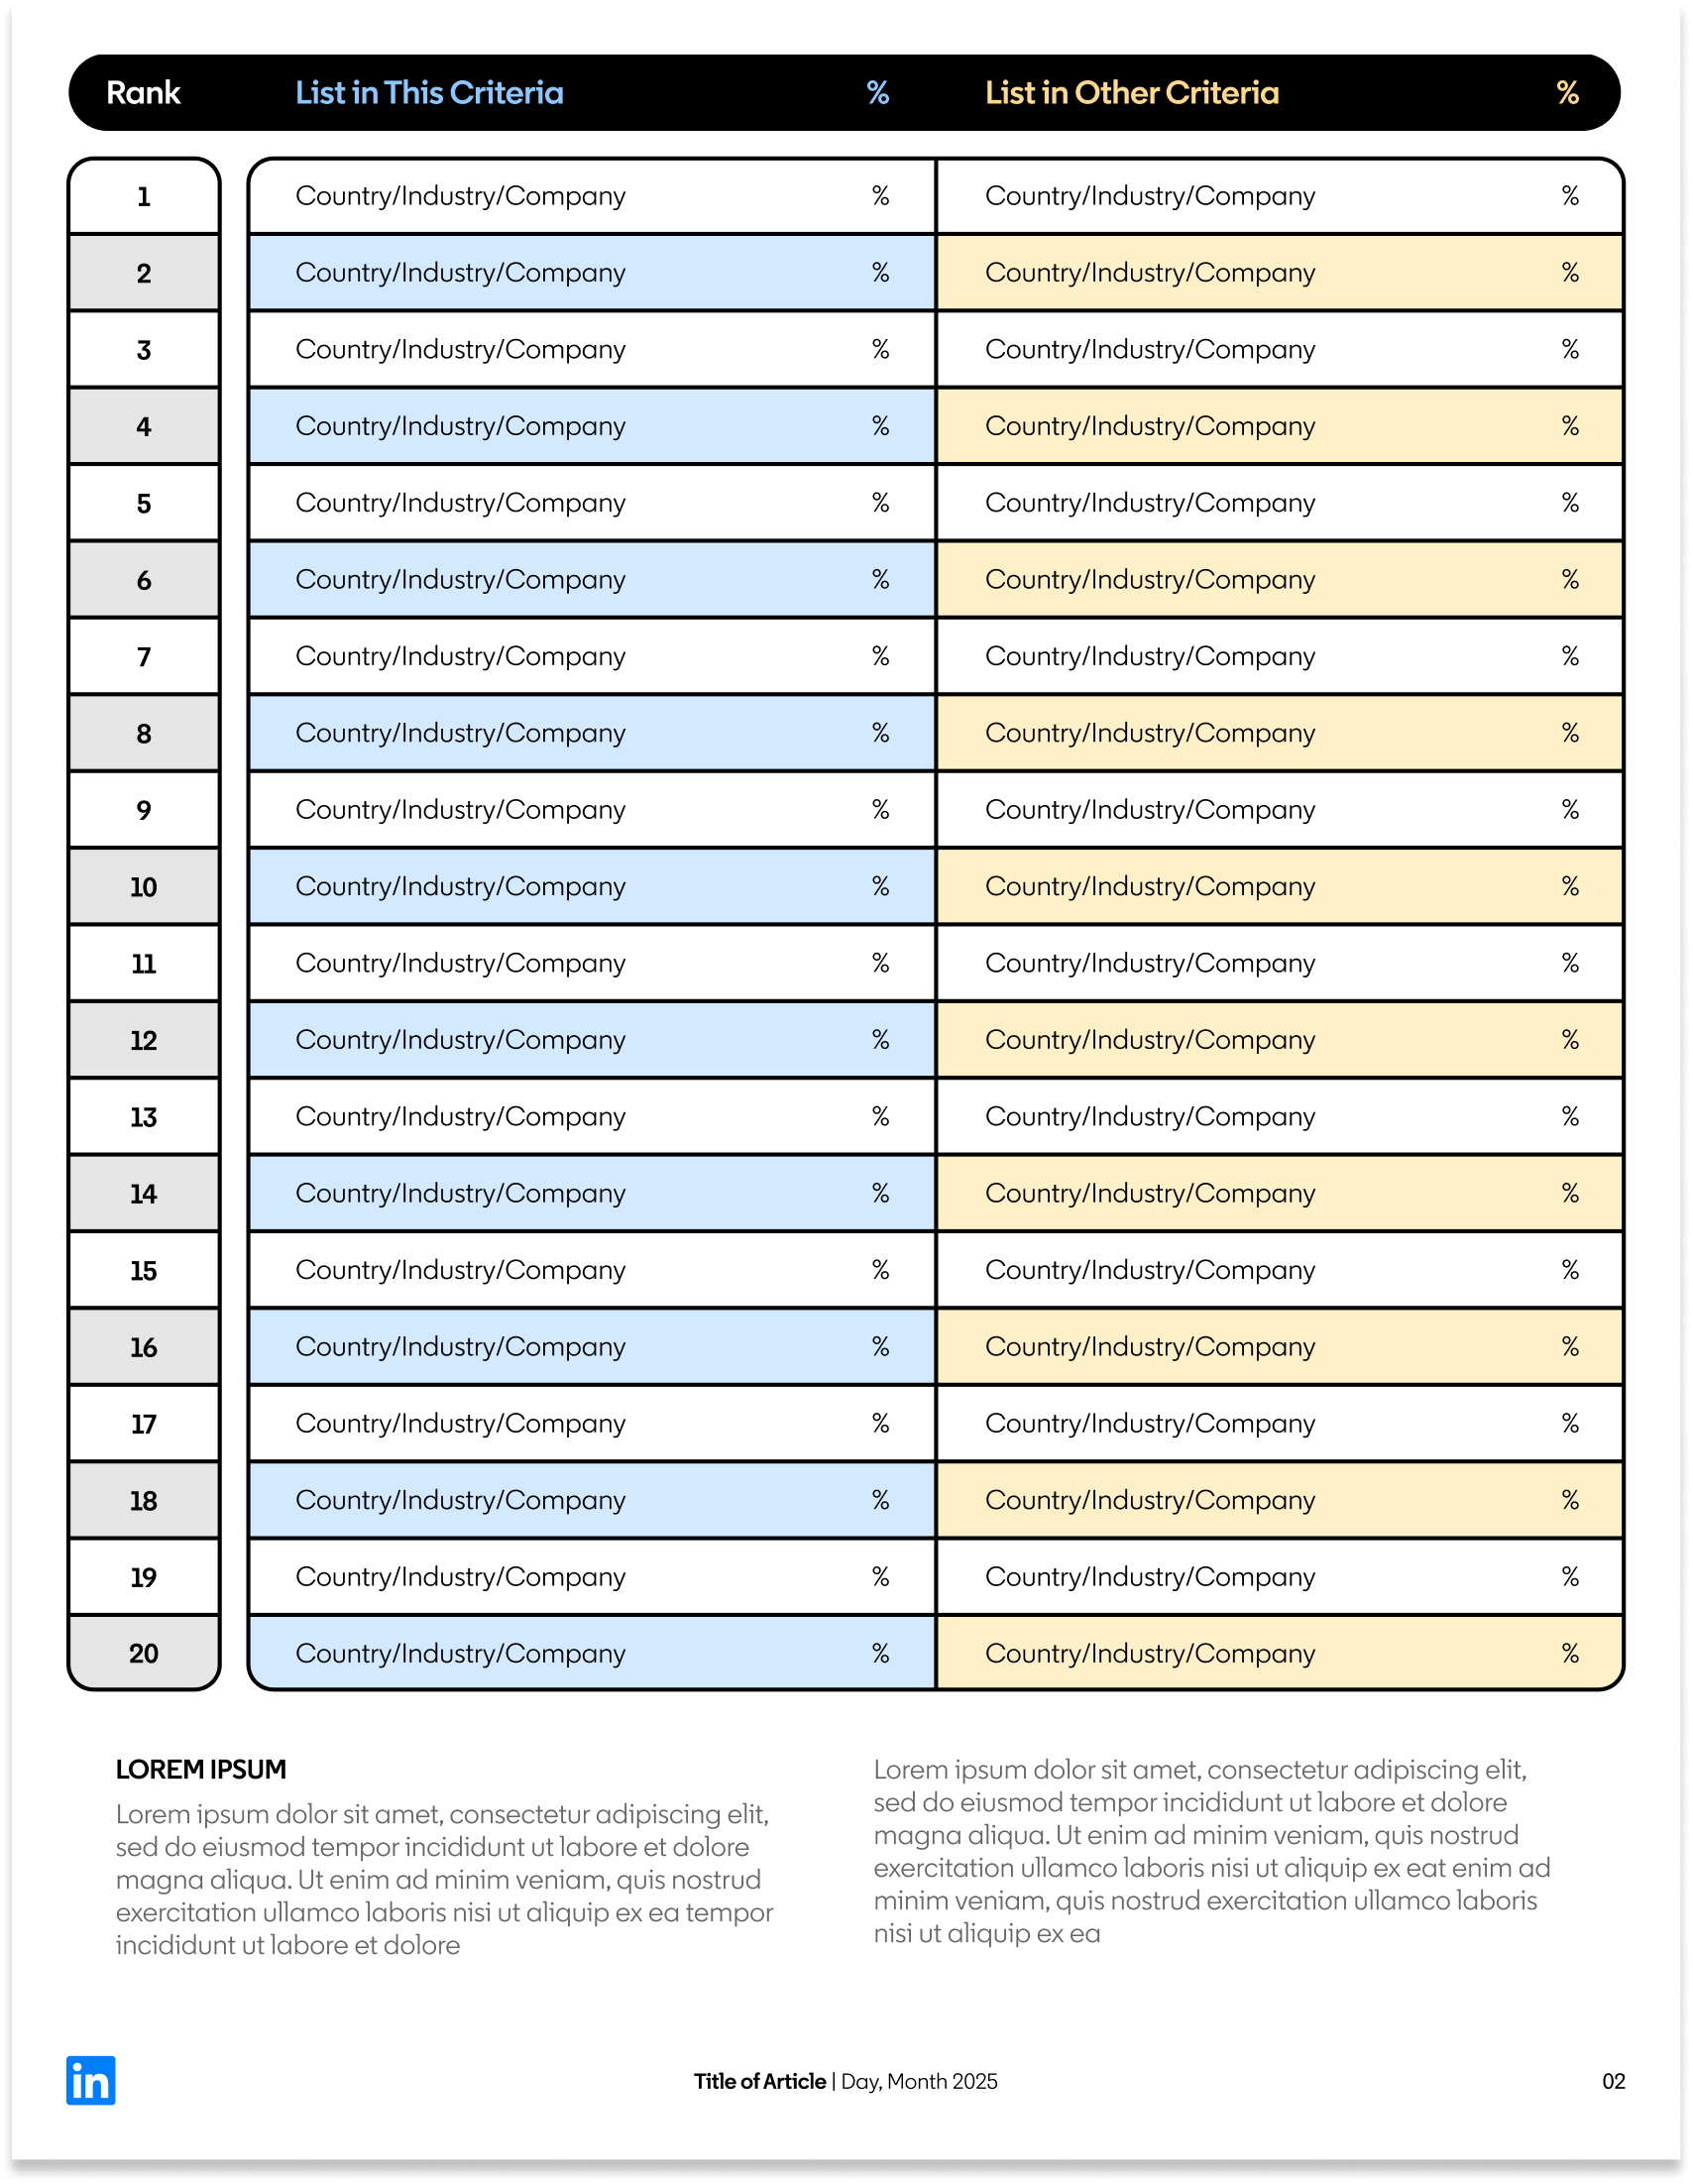
Creating the tools for a flexible, expansive system that tells stories with data.